1912 Washington gubernatorial election
 | |||||||||||||||||||||||||||||||||||||
| |||||||||||||||||||||||||||||||||||||
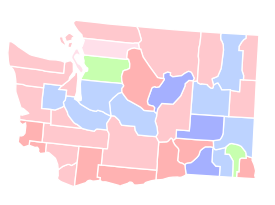 County results Lister: 30–40% 40–50% Hay: 20–30% 30–40% 40–50% Hodge: 30–40% | |||||||||||||||||||||||||||||||||||||
| |||||||||||||||||||||||||||||||||||||


| Elections in Washington | ||||||||
|---|---|---|---|---|---|---|---|---|
 | ||||||||
| State government | ||||||||
|
The 1912 Washington gubernatorial election was held on November 5, 1912. Democratic nominee Ernest Lister defeated Republican incumbent Marion E. Hay with 30.55% of the vote. Lister was voted in with the smallest percentage of the vote in a gubernatorial election in the 1900s.[1] This was the first election in Washington in which women had the right to vote.
Primary election
Primary elections were held on September 10, 1912.[2]
Democratic party
Candidates
- W. W. Black
- Ernest Lister, former member of the Tacoma City Council
- Hugh C. Todd
- E. C. Million
- M. M. Godman
- William Henry Dunphy
- L. F. Chester
Results
| Party | Candidate | Votes | % | |
|---|---|---|---|---|
| Democratic | W. W. Black | 4,451 | 20.01% | |
| Democratic | Ernest Lister | 4,420 | 19.87% | |
| Democratic | Hugh C. Todd | 3,448 | 15.50% | |
| Democratic | William Henry Dunphy | 2,966 | 13.33% | |
| Democratic | E. C. Million | 2,788 | 12.53% | |
| Democratic | M. M. Godman | 2,649 | 11.91% | |
| Democratic | L. F. Chester | 1,521 | 6.84% | |
| Total votes | 22,243 | 100.00% | ||
Since no candidate received more than 40% of the first choice votes, the second choice votes were counted. W. W. Black was disqualified for being a sitting judge, so the second-placed Ernest Lister was ultimately the Democratic nominee.
| Party | Candidate | Votes | % | |
|---|---|---|---|---|
| Democratic | W. W. Black | 8,166 | 18.68% | |
| Democratic | Ernest Lister | 7,629 | 17.45% | |
| Democratic | Hugh C. Todd | 7,322 | 16.75% | |
| Democratic | E. C. Million | 5,739 | 13.13% | |
| Democratic | M. M. Godman | 5,517 | 12.62% | |
| Democratic | William Henry Dunphy | 5,357 | 12.26% | |
| Democratic | L. F. Chester | 3,980 | 9.11% | |
| Total votes | 43,710 | 100.00% | ||
Republican party
Candidates
- Marion E. Hay, incumbent Governor
- Orville Billings
Results
| Party | Candidate | Votes | % | |
|---|---|---|---|---|
| Republican | Marion E. Hay (incumbent) | 69,005 | 76.93% | |
| Republican | Orville Billings | 20,689 | 23.07% | |
| Total votes | 89,694 | 100.00% | ||
General election
Candidates
Major party candidates
- Ernest Lister, Democratic
- Marion E. Hay, Republican
Other candidates
- Robert T. Hodge, Progressive
- Anna A. Maley, Socialist
- George F. Stivers, Prohibition
- Abraham Lincoln Brearcliff, Socialist Labor
Results
| Party | Candidate | Votes | % | ±% | |
|---|---|---|---|---|---|
| Democratic | Ernest Lister | 97,251 | 30.55% | −2.45% | |
| Republican | Marion E. Hay (incumbent) | 96,629 | 30.35% | −32.21% | |
| Progressive | Robert T. Hodge | 77,792 | 24.44% | ||
| Socialist | Anna A. Maley | 37,155 | 11.67% | +9.23% | |
| Prohibition | George F. Stivers | 8,163 | 2.56% | +0.57% | |
| Socialist Labor | Abraham Lincoln Brearcliff | 1,369 | 0.43% | ||
| Majority | 622 | 0.20% | |||
| Total votes | 318,359 | 100.00% | |||
| Democratic gain from Republican | Swing | +29.75% | |||
Results by county
| County[5] | Ernest Lister Democratic | Marion E. Hay Republican | Robert T. Hodge Progressive | Anna A. Maley Socialist | George F. Stivers Prohibition | Abraham L. Brearcliff Socialist Labor | Margin | Total votes cast | |||||||
|---|---|---|---|---|---|---|---|---|---|---|---|---|---|---|---|
| # | % | # | % | # | % | # | % | # | % | # | % | # | % | ||
| Adams | 970 | 42.34% | 847 | 36.97% | 286 | 12.48% | 138 | 6.02% | 43 | 1.88% | 7 | 0.31% | 123 | 5.37% | 2,291 |
| Asotin | 501 | 25.47% | 802 | 45.57% | 250 | 14.20% | 127 | 7.22% | 76 | 4.32% | 4 | 0.23% | -301 | -17.10% | 1,760 |
| Benton | 1,199 | 32.34% | 1,486 | 40.06% | 623 | 16.81% | 320 | 8.63% | 58 | 1.56% | 21 | 0.57% | -287 | -7.74% | 3,707 |
| Chehalis | 1,907 | 21.69% | 3,644 | 41.44% | 1,336 | 15.19% | 1,735 | 19.73% | 141 | 1.60% | 31 | 0.35% | -1,737 | -19.75% | 8,794 |
| Chelan | 1,037 | 20.28% | 1,802 | 35.24% | 1,480 | 28.94% | 634 | 12.40% | 140 | 2.74% | 21 | 0.41% | -322[b] | -6.30% | 5,114 |
| Clallam | 422 | 16.78% | 781 | 31.05% | 670 | 26.64% | 617 | 24.53% | 17 | 0.68% | 8 | 0.32% | -111[b] | -4.41% | 2,515 |
| Clark | 2,434 | 31.48% | 2,532 | 32.74% | 1,326 | 17.15% | 951 | 12.30% | 466 | 6.03% | 24 | 0.31% | -98 | -1.27% | 7,733 |
| Columbia | 986 | 39.05% | 830 | 32.87% | 513 | 20.32% | 148 | 5.86% | 46 | 1.82% | 2 | 0.08% | 156 | 6.18% | 2,525 |
| Cowlitz | 803 | 21.04% | 1,352 | 35.42% | 1,103 | 28.90% | 501 | 13.13% | 53 | 1.39% | 5 | 0.13% | -249[b] | -6.52% | 3,817 |
| Douglas | 1,352 | 43.66% | 837 | 27.03% | 550 | 17.76% | 290 | 9.36% | 61 | 1.97% | 7 | 0.23% | 515 | 16.63% | 3,097 |
| Ferry | 538 | 32.20% | 577 | 34.53% | 251 | 15.02% | 269 | 16.10% | 10 | 0.60% | 26 | 1.56% | -39 | -2.33% | 1,671 |
| Franklin | 508 | 29.18% | 717 | 41.18% | 206 | 11.83% | 270 | 15.51% | 32 | 1.84% | 8 | 0.46% | -209 | -12.00% | 1,741 |
| Garfield | 473 | 30.92% | 369 | 24.12% | 585 | 38.24% | 71 | 4.64% | 31 | 2.03% | 1 | 0.07% | -112[c] | -7.32% | 1,530 |
| Grant | 720 | 27.94% | 906 | 35.16% | 533 | 20.68% | 372 | 14.44% | 38 | 1.47% | 8 | 0.31% | -186 | -7.22% | 2,577 |
| Island | 272 | 17.63% | 443 | 28.71% | 435 | 28.19% | 326 | 21.13% | 66 | 4.28% | 1 | 0.06% | -8[b] | -0.52% | 1,543 |
| Jefferson | 602 | 26.57% | 893 | 39.41% | 485 | 21.40% | 273 | 12.05% | 6 | 0.26% | 7 | 0.31% | -291 | -12.84% | 2,266 |
| King | 26,243 | 37.07% | 18,927 | 26.74% | 18,727 | 26.45% | 5,594 | 7.90% | 825 | 1.17% | 476 | 0.67% | 7,316 | 10.33% | 70,792 |
| Kitsap | 1,031 | 17.39% | 1,820 | 30.70% | 1,572 | 26.51% | 1,391 | 23.46% | 76 | 1.28% | 39 | 0.66% | -248[b] | -4.19% | 5,929 |
| Kittitas | 1,580 | 31.29% | 1,422 | 28.16% | 1,505 | 29.80% | 411 | 8.14% | 114 | 2.26% | 18 | 0.36% | 75[d] | 1.49% | 5,050 |
| Klickitat | 917 | 27.49% | 1,565 | 46.91% | 424 | 12.71% | 334 | 10.01% | 85 | 2.55% | 11 | 0.33% | -648 | -19.42% | 3,336 |
| Lewis | 2,879 | 29.69% | 3,127 | 32.25% | 1,683 | 17.36% | 1,667 | 17.19% | 317 | 3.27% | 24 | 0.25% | -248 | -2.56% | 9,697 |
| Lincoln | 1,733 | 36.72% | 1,704 | 36.10% | 963 | 20.40% | 229 | 4.85% | 77 | 1.63% | 14 | 0.30% | 29 | 0.61% | 4,720 |
| Mason | 570 | 31.77% | 483 | 26.92% | 349 | 19.45% | 374 | 20.85% | 13 | 0.72% | 5 | 0.28% | 87 | 4.85% | 1,794 |
| Okanogan | 1,196 | 28.42% | 1,577 | 37.48% | 516 | 12.26% | 874 | 20.77% | 28 | 0.67% | 17 | 0.40% | -381 | -9.05% | 4,208 |
| Pacific | 904 | 22.56% | 1,755 | 43.80% | 916 | 22.86% | 347 | 8.66% | 78 | 1.95% | 7 | 0.17% | -839[b] | -20.94% | 4,007 |
| Pend Oreille | 641 | 31.48% | 778 | 38.21% | 286 | 14.05% | 302 | 14.83% | 26 | 1.28% | 3 | 0.15% | -137 | -6.73% | 2,036 |
| Pierce | 10,724 | 34.00% | 6,972 | 22.10% | 9,514 | 30.16% | 3,506 | 11.11% | 711 | 2.25% | 118 | 0.37% | 1,210[d] | 3.84% | 31,545 |
| San Juan | 269 | 22.32% | 414 | 34.36% | 285 | 23.65% | 217 | 18.01% | 15 | 1.24% | 5 | 0.41% | -129[b] | -10.71% | 1,205 |
| Skagit | 2.090 | 22.91% | 2,579 | 28.27% | 2,389 | 26.19% | 1,642 | 18.00% | 369 | 4.05% | 53 | 0.58% | -190[b] | -2.08% | 9,122 |
| Skamania | 230 | 28.29% | 343 | 42.19% | 147 | 18.08% | 83 | 10.21% | 7 | 0.86% | 3 | 0.37% | -113 | -13.90% | 813 |
| Snohomish | 3,597 | 19.09% | 3,677 | 19.52% | 6,930 | 36.79% | 3,847 | 20.42% | 700 | 3.72% | 88 | 0.47% | -3,083[e] | -16.37% | 18,839 |
| Spokane | 10,576 | 30.54% | 11,792 | 34.05% | 9,387 | 27.11% | 2,047 | 5.91% | 704 | 2.03% | 122 | 0.35% | -1,216 | -3.51% | 34,628 |
| Stevens | 1,873 | 31.82% | 1,547 | 26.28% | 1,227 | 20.85% | 971 | 16.50% | 245 | 4.16% | 23 | 0.39% | 326 | 5.54% | 5,886 |
| Thurston | 1,634 | 25.88% | 1,974 | 31.26% | 1,397 | 22.13% | 1,138 | 18.02% | 160 | 2.53% | 11 | 0.17% | -340 | -5.38% | 6,314 |
| Wahkiakum | 134 | 15.65% | 374 | 43.69% | 228 | 26.64% | 107 | 12.50% | 10 | 1.17% | 3 | 0.35% | -146[b] | -17.05% | 856 |
| Walla Walla | 3,386 | 45.21% | 2,355 | 31.44% | 1,309 | 17.48% | 313 | 4.18% | 115 | 1.54% | 12 | 0.16% | 1,031 | 13.77% | 7,490 |
| Whatcom | 2,785 | 18.83% | 4,576 | 30.93% | 4,014 | 27.13% | 2,924 | 19.76% | 420 | 2.84% | 75 | 0.51% | -562[b] | -3.80% | 14,794 |
| Whitman | 3,519 | 36.19% | 3,481 | 35.80% | 1,034 | 10.63% | 574 | 5.90% | 1,099 | 11.30% | 16 | 0.16% | 38 | 0.39% | 9,723 |
| Yakima | 4,016 | 31.29% | 4,569 | 35.60% | 2,297 | 17.90% | 1,221 | 9.51% | 685 | 5.34% | 45 | 0.35% | -553 | -4.31% | 12,833 |
| Totals | 97,251 | 30.55% | 96,629 | 30.35% | 77,792[f] | 24.44% | 37,155 | 11.67% | 8,163 | 2.56% | 1,369 | 0.43% | 622 | 0.20% | 318,359 |
Counties that flipped from Republican to Democratic
Counties that flipped from Republican to Progressive
Notes
- ^ These are the stated combined totals; for all candidates the sum of first and second choice votes does not equal the stated combined total
- ^ a b c d e f g h i j Hay's margin over Hodge
- ^ Hodge's margin over Lister
- ^ a b Lister's margin over Hodge
- ^ Hodge's margin over Maley; Maley ran ahead of both Lister and Hay in this county
- ^ The county figures add up to 77,731
References
- ^ Skelley, Geoffrey (September 13, 2021). "Everything You Need To Know About The California Recall Election". FiveThirtyEight. Retrieved September 24, 2021.
- ^ a b c "Elections Search Results: September 1912 Primary". Washington Secretary of State. Retrieved July 31, 2020.
- ^ a b c Washington Secretary of State. "For Governor". Abstract of Votes Polled in the State of Washington at the Primary Election Held September 10, 1912. Olympia, Washington. pp. 9–11.
- ^ "Elections Search Results: November 1912 General". Washington Secretary of State. Retrieved July 31, 2020.
- ^ a b Washington Secretary of State. "For Governor". Abstract of Votes Polled in the State of Washington at the General Election Held November 5, 1912. Olympia, Washington. p. 10.


