Local government elections in Norfolk, England
Breckland District Council in Norfolk, England, is elected every four years.
Council elections
For by-election results, please see the page on Breckland District Council By-elections.
Council composition
| Year | Conservative | Liberal Democrats | Labour | Green | UKIP | Independent | Council control
after election |
| | | | | | |
| 1991 | 32 | 1 | 8 | 0 | 0 | 11 | | Conservative |
| 1995 | 18 | 2 | 24 | 1 | 0 | 7 | | No overall control |
| 1999 | 33 | 2 | 14 | 0 | 0 | 3 | | Conservative |
| 2003 | 42 | 0 | 8 | 0 | 0 | 4 | | Conservative |
| 2007 | 48 | 0 | 3 | 0 | 0 | 3 | | Conservative |
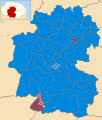
| 2011 | 47 | 0 | 4 | 0 | 0 | 4 | | Conservative |
| 2015 | 42 | 0 | 2 | 0 | 4 | 1 | | Conservative |
| 2019 | 37 | 0 | 6 | 2 | 0 | 4 | | Conservative |
| 2023 | 30 | 1 | 12 | 1 | 0 | 5 | | Conservative |
District result maps
-
2011 results map
-
2015 results map
-
2019 results map
-
2023 results map
By-election results
Eynsford By-Election 6 February 1997 | Party | Candidate | Votes | % | ±% |
| | Labour | | 235 | 40.1 | |
| | Conservative | | 211 | 36.0 | |
| | Liberal Democrats | | 140 | 23.9 | |
| Majority | 24 | 4.1 | |
| Turnout | 586 | 41.0 | |
| | Labour hold | Swing | | |
Hermitage By-Election 14 August 1997 | Party | Candidate | Votes | % | ±% |
| | Labour | | 335 | 57.7 | +6.4 |
| | Conservative | | 214 | 36.8 | +36.8 |
| | Liberal Democrats | | 32 | 5.5 | +5.5 |
| Majority | 121 | 20.9 | |
| Turnout | 581 | 45.0 | |
| | Labour hold | Swing | | |
Conifer By-Election 4 December 1997 | Party | Candidate | Votes | % | ±% |
| | Conservative | | 366 | 65.4 | +21.4 |
| | Labour | | 128 | 22.8 | −33.2 |
| | Liberal Democrats | | 66 | 11.8 | +11.8 |
| Majority | 238 | 42.6 | |
| Turnout | 560 | | |
| | Conservative gain from Labour | Swing | | |
Upper Wensum By-Election 26 March 1998 | Party | Candidate | Votes | % | ±% |
| | Conservative | | 321 | 47.1 | |
| | Labour | | 166 | 24.4 | |
| | Independent | | 165 | 24.2 | |
| | Green | | 29 | 4.3 | |
| Majority | 155 | 22.7 | |
| Turnout | 681 | 45.0 | |
| | Conservative gain from Labour | Swing | | |
Thetford Guildhall By-Election 9 July 1998 | Party | Candidate | Votes | % | ±% |
| | Conservative | | 662 | 58.0 | +39.3 |
| | Labour | | 302 | 26.4 | −12.1 |
| | Liberal Democrats | | 178 | 15.6 | −7.2 |
| Majority | 360 | 31.6 | |
| Turnout | 1,142 | 20.0 | |
| | Conservative gain from Labour | Swing | | |
Thetford Barnham Cross By-Election 8 March 2001 | Party | Candidate | Votes | % | ±% |
| | Labour | | 281 | 58.3 | −12.4 |
| | Conservative | | 163 | 33.8 | +13.9 |
| | Liberal Democrats | | 38 | 7.9 | −1.5 |
| Majority | 118 | 24.5 | |
| Turnout | 482 | 18.4 | |
| | Labour hold | Swing | | |
East Dereham Town By-Election 28 June 2001 | Party | Candidate | Votes | % | ±% |
| | Liberal Democrats | | 278 | 51.6 | +36.6 |
| | Conservative | | 200 | 37.1 | +6.7 |
| | Green | | 61 | 11.3 | +2.4 |
| Majority | 78 | 14.5 | |
| Turnout | 539 | 25.0 | |
| | Liberal Democrats gain from Labour | Swing | | |
Swaffham By-Election 22 June 2006 | Party | Candidate | Votes | % | ±% |
| | Conservative | Frank Sharpe | 851 | 66.3 | +11.2 |
| | Labour | Margaret Holmes | 243 | 19.0 | +19.0 |
| | Liberal Democrats | David Thomas | 189 | 14.7 | −30.2 |
| Majority | 608 | 47.3 | |
| Turnout | 1,283 | 24.3 | |
| | Conservative hold | Swing | | |
Attleborough Queens And Besthorpe 5 May 2016 | Party | Candidate | Votes | % | ±% |
| | Conservative | Stephen Askew | 546 | 42.0 | +1.7 |
| | Labour | Philip Andrew Spiby | 393 | 30.2 | +11.6 |
| | Independent | Anthony Frederick Crouch | 360 | 27.7 | +27.7 |
| Majority | | | |
| Turnout | 698 | 18.2 | |
| | Conservative hold | Swing | | |
Saham Toney 16 March 2017 | Party | Candidate | Votes | % | ±% |
| | Conservative | Theresa Ruth Hewett | 335 | 48.1 | −2.8 |
| | Liberal Democrats | Andrew Thorpe | 105 | 15.1 | +15.1 |
| | Independent | Patricia Helena Warwick | 104 | 14.9 | +14.9 |
| | UKIP | David Williams | 80 | 11.5 | −20.1 |
| | Labour | Joseph Manuel Sisto | 72 | 10.3 | +10.3 |
| Majority | | | |
| Turnout | 698 | 18.2 | |
| | Conservative hold | Swing | | |
Harling & Heathlands 4 May 2017 | Party | Candidate | Votes | % | ±% |
| | Conservative | Robert George Kybird | 666 | 75.0 | |
| | Labour | Christopher Harvey | 223 | 25.0 | |
| Majority | | | |
| Turnout | 900 | 35.81 | |
| | Conservative hold | Swing | | |
Note: swings cannot be given: Harling and Heathlands was previously uncontested.
Thetford Priory 28 September 2017 | Party | Candidate | Votes | % | ±% |
| | Labour | Michael Patrick Brindle | 503 | 57.7 | +28.0 |
| | Conservative | Jane Lillian James | 257 | 29.5 | −3.7 |
| | UKIP | Dean Roberts | 112 | 12.8 | −24.3 |
| Majority | | | |
| Turnout | 874 | 17.40 | |
| | Labour gain from Conservative | Swing | | |
References
- ^ The District of Breckland (Electoral Arrangements) Order 1978
- ^ legislation.gov.uk – The Cambridgeshire, Norfolk and Suffolk (County Boundaries) Order 1990. Retrieved on 5 November 2015.
- ^ legislation.gov.uk – The District of Breckland (Electoral Changes) Order 2002. Retrieved on 4 October 2015.
- ^ legislation.gov.uk – The Breckland (Electoral Changes) Order 2014. Retrieved on 3 November 2015.
External links
 2011 results map
 2015 results map
 2019 results map
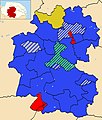 2023 results map


 Council elections in Norfolk


