Ward in England
| Metropolitan county | |
|---|
| Region | |
|---|
| Country | England |
|---|
| Sovereign state | United Kingdom |
|---|
| Post town | BIRMINGHAM |
|---|
| Postcode district | B25 |
|---|
| Dialling code | 0121 |
|---|
|
| Police | West Midlands |
|---|
| Fire | West Midlands |
|---|
| Ambulance | West Midlands |
|---|
| |
| UK Parliament | |
|---|
| 52°28′38″N 1°48′28″W / 52.4772°N 1.8078°W / 52.4772; -1.8078 |
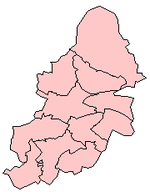
Stechford and Yardley North is one of the 40 electoral wards in Birmingham, England.
Stechford and Yardley North is one of the four wards that make up the council constituency of Yardley. It covers an area of 4.4 square kilometres.
East Yardley, part of Garretts Green, Glebe Farm, Old Yardley Village, Poolway, Stechford including Stechford Village and Whittington Oval Estate are areas all covered by the ward.
Population
According to the 2001 Population Census there were 22,976 people living in 10,001 households in Stechford and Yardley North with a population density of 5,170 people per km2 compared with 3,649 people per km2 for Birmingham. 15.1% (3,458) of the ward's population consists of ethnic minorities compared with 29.6% for Birmingham in general. The population of the ward as taken at the 2011 census had increased to 25,757.
Politics
As of 2005, the three councillors representing Stechford and Yardley North on Birmingham City Council are Neil Eustace, Barbara Jackson and Carol Jones, all of the Liberal Democrat Party.
The ward has adopted a Ward Support Officer, with the current holder of the title being Osaf Ahmed.
Places of interest
The ward is served by two libraries; Kents Moat and Glebe Farm libraries. There are numerous areas of open space and recreation grounds.
There is one secondary school, one nursery school and five primary schools located in Stechford and Yardley North.
Stechford railway station and Lea Hall railway station both serve the ward.
Sport
Stechford Cascades is a swimming facility in Stechford with an adjacent gym. Sheldon Marlborough Cricket Club, a privately managed cricket club, is located within the boundaries. Sedgmere Sports and Social Club and Co-op Sports and Social Club, two privately managed sports and social clubs are located within the boundaries.
Stechford Football Club was created through funding from the Neighbourhood Renewal Fund.
Ward description
The ward covers an area of {} Birmingham, including the districts of {}.
Ward demographics (from the census of 2001)
Ward history
The ward was created in {}, with the boundaries being unaltered until {}.
Parliamentary representation
The ward has been part of Birmingham {} constituency.
Politics
Election results
Extended content |
2000s 6 May 2010 Electorate
Turnout %, | Party | Candidate | Votes | % | ±% | | | Conservative | | | % | | | | Labour | | | % | | | | Liberal | | | % | | | | Independent | | | % | | | Majority | | % | | | | Labour gain from Liberal | Swing | | | | | Conservative hold | Swing | | | 7 May 2009 Electorate
Turnout %, | Party | Candidate | Votes | % | ±% | | | Conservative | | | % | | | | Labour | | | % | | | | Liberal | | | % | | | | Independent | | | % | | | Majority | | % | | | | Labour gain from Liberal | Swing | | | | | Conservative hold | Swing | | | 1 May 2008 Electorate
Turnout %, | Party | Candidate | Votes | % | ±% | | | Conservative | | | % | | | | Labour | | | % | | | | Liberal | | | % | | | | Independent | | | % | | | Majority | | % | | | | Labour gain from Liberal | Swing | | | | | Conservative hold | Swing | | | 3 May 2007 Electorate
Turnout %, | Party | Candidate | Votes | % | ±% | | | Conservative | | | % | | | | Labour | | | % | | | | Liberal | | | % | | | | Independent | | | % | | | Majority | | % | | | | Labour gain from Liberal | Swing | | | | | Conservative hold | Swing | | | 4 May 2006 Electorate
Turnout %, | Party | Candidate | Votes | % | ±% | | | Conservative | | | % | | | | Labour | | | % | | | | Liberal | | | % | | | | Independent | | | % | | | Majority | | % | | | | Labour gain from Liberal | Swing | | | | | Conservative hold | Swing | | | 5 May 2005 Electorate
Turnout %, | Party | Candidate | Votes | % | ±% | | | Conservative | | | % | | | | Labour | | | % | | | | Liberal | | | % | | | | Independent | | | % | | | Majority | | % | | | | Labour gain from Liberal | Swing | | | | | Conservative hold | Swing | | | 6 May 2004 Electorate
Turnout %, | Party | Candidate | Votes | % | ±% | | | Conservative | | | % | | | | Labour | | | % | | | | Liberal | | | % | | | | Independent | | | % | | | Majority | | % | | | | Labour gain from Liberal | Swing | | | | | Conservative hold | Swing | | | 1 May 2003 Electorate
Turnout %, | Party | Candidate | Votes | % | ±% | | | Conservative | | | % | | | | Labour | | | % | | | | Liberal | | | % | | | | Independent | | | % | | | Majority | | % | | | | Labour gain from Liberal | Swing | | | | | Conservative hold | Swing | | | 2 May 2002 Electorate
Turnout %, | Party | Candidate | Votes | % | ±% | | | Conservative | | | % | | | | Labour | | | % | | | | Liberal | | | % | | | | Independent | | | % | | | Majority | | % | | | | Labour gain from Liberal | Swing | | | | | Conservative hold | Swing | | | 7 June 2001 Electorate
Turnout %, | Party | Candidate | Votes | % | ±% | | | Conservative | | | % | | | | Labour | | | % | | | | Liberal | | | % | | | | Independent | | | % | | | Majority | | % | | | | Labour gain from Liberal | Swing | | | | | Conservative hold | Swing | | | 4 May 2000 Electorate
Turnout %, | Party | Candidate | Votes | % | ±% | | | Conservative | | | % | | | | Labour | | | % | | | | Liberal | | | % | | | | Independent | | | % | | | Majority | | % | | | | Labour gain from Liberal | Swing | | | | | Conservative hold | Swing | | | 1990s 6 May 1999 Electorate
Turnout %, | Party | Candidate | Votes | % | ±% | | | Conservative | | | % | | | | Labour | | | % | | | | Liberal | | | % | | | | Independent | | | % | | | Majority | | % | | | | Labour gain from Liberal | Swing | | | | | Conservative hold | Swing | | | 7 May 1998 Electorate
Turnout %, | Party | Candidate | Votes | % | ±% | | | Conservative | | | % | | | | Labour | | | % | | | | Liberal | | | % | | | | Independent | | | % | | | Majority | | % | | | | Labour gain from Liberal | Swing | | | | | Conservative hold | Swing | | | 1 May 1997 Electorate
Turnout %, | Party | Candidate | Votes | % | ±% | | | Conservative | | | % | | | | Labour | | | % | | | | Liberal | | | % | | | | Independent | | | % | | | Majority | | % | | | | Labour gain from Liberal | Swing | | | | | Conservative hold | Swing | | | 2 May 1996 Electorate
Turnout %, | Party | Candidate | Votes | % | ±% | | | Conservative | | | % | | | | Labour | | | % | | | | Liberal | | | % | | | | Independent | | | % | | | Majority | | % | | | | Labour gain from Liberal | Swing | | | | | Conservative hold | Swing | | | 4 May 1995 Electorate
Turnout %, | Party | Candidate | Votes | % | ±% | | | Conservative | | | % | | | | Labour | | | % | | | | Liberal | | | % | | | | Independent | | | % | | | Majority | | % | | | | Labour gain from Liberal | Swing | | | | | Conservative hold | Swing | | | 5 May 1994 Electorate
Turnout %, | Party | Candidate | Votes | % | ±% | | | Conservative | | | % | | | | Labour | | | % | | | | Liberal | | | % | | | | Independent | | | % | | | Majority | | % | | | | Labour gain from Liberal | Swing | | | | | Conservative hold | Swing | | | 6 May 1993 Electorate
Turnout %, | Party | Candidate | Votes | % | ±% | | | Conservative | | | % | | | | Labour | | | % | | | | Liberal | | | % | | | | Independent | | | % | | | Majority | | % | | | | Labour gain from Liberal | Swing | | | | | Conservative hold | Swing | | | 7 May 1992 Electorate
Turnout %, | Party | Candidate | Votes | % | ±% | | | Conservative | | | % | | | | Labour | | | % | | | | Liberal | | | % | | | | Independent | | | % | | | Majority | | % | | | | Labour gain from Liberal | Swing | | | | | Conservative hold | Swing | | | 2 May 1991 Electorate
Turnout %, | Party | Candidate | Votes | % | ±% | | | Conservative | | | % | | | | Labour | | | % | | | | Liberal | | | % | | | | Independent | | | % | | | Majority | | % | | | | Labour gain from Liberal | Swing | | | | | Conservative hold | Swing | | | 3 May 1990 Electorate
Turnout %, | Party | Candidate | Votes | % | ±% | | | Conservative | | | % | | | | Labour | | | % | | | | Liberal | | | % | | | | Independent | | | % | | | Majority | | % | | | | Labour gain from Liberal | Swing | | | | | Conservative hold | Swing | | | 1980s 4 May 1989 Electorate
Turnout %, | Party | Candidate | Votes | % | ±% | | | Conservative | | | % | | | | Labour | | | % | | | | Liberal | | | % | | | | Independent | | | % | | | Majority | | % | | | | Labour gain from Liberal | Swing | | | | | Conservative hold | Swing | | | 5 May 1988 Electorate
Turnout %, | Party | Candidate | Votes | % | ±% | | | Conservative | | | % | | | | Labour | | | % | | | | Liberal | | | % | | | | Independent | | | % | | | Majority | | % | | | | Labour gain from Liberal | Swing | | | | | Conservative hold | Swing | | | 7 May 1987 Electorate
Turnout %, | Party | Candidate | Votes | % | ±% | | | Conservative | | | % | | | | Labour | | | % | | | | Liberal | | | % | | | | Independent | | | % | | | Majority | | % | | | | Labour gain from Liberal | Swing | | | | | Conservative hold | Swing | | | 1 May 1986 Electorate
Turnout %, | Party | Candidate | Votes | % | ±% | | | Conservative | | | % | | | | Labour | | | % | | | | Liberal | | | % | | | | Independent | | | % | | | Majority | | % | | | | Labour gain from Liberal | Swing | | | | | Conservative hold | Swing | | | 2 May 1985 Electorate
Turnout %, | Party | Candidate | Votes | % | ±% | | | Conservative | | | % | | | | Labour | | | % | | | | Liberal | | | % | | | | Independent | | | % | | | Majority | | % | | | | Labour gain from Liberal | Swing | | | | | Conservative hold | Swing | | | 3 May 1984 Electorate
Turnout %, | Party | Candidate | Votes | % | ±% | | | Conservative | | | % | | | | Labour | | | % | | | | Liberal | | | % | | | | Independent | | | % | | | Majority | | % | | | | Labour gain from Liberal | Swing | | | | | Conservative hold | Swing | | | 5 May 1983 Electorate
Turnout %, | Party | Candidate | Votes | % | ±% | | | Conservative | | | % | | | | Labour | | | % | | | | Liberal | | | % | | | | Independent | | | % | | | Majority | | % | | | | Labour gain from Liberal | Swing | | | | | Conservative hold | Swing | | | 6 May 1982 Electorate
Turnout %, | Party | Candidate | Votes | % | ±% | | | Conservative | | | % | | | | Labour | | | % | | | | Liberal | | | % | | | | Independent | | | % | | | Majority | | % | | | | Labour gain from Liberal | Swing | | | | | Conservative hold | Swing | | | 7 May 1981 Electorate
Turnout %, | Party | Candidate | Votes | % | ±% | | | Conservative | | | % | | | | Labour | | | % | | | | Liberal | | | % | | | | Independent | | | % | | | Majority | | % | | | | Labour gain from Liberal | Swing | | | | | Conservative hold | Swing | | | 1 May 1980 Electorate
Turnout %, | Party | Candidate | Votes | % | ±% | | | Conservative | | | % | | | | Labour | | | % | | | | Liberal | | | % | | | | Independent | | | % | | | Majority | | % | | | | Labour gain from Liberal | Swing | | | | | Conservative hold | Swing | | | 1970s 3 May 1979 Electorate
Turnout %, | Party | Candidate | Votes | % | ±% | | | Conservative | | | % | | | | Labour | | | % | | | | Liberal | | | % | | | | Independent | | | % | | | Majority | | % | | | | Labour gain from Liberal | Swing | | | | | Conservative hold | Swing | | | 4 May 1978 Electorate
Turnout %, | Party | Candidate | Votes | % | ±% | | | Conservative | | | % | | | | Labour | | | % | | | | Liberal | | | % | | | | Independent | | | % | | | Majority | | % | | | | Labour gain from Liberal | Swing | | | | | Conservative hold | Swing | | | 5 May 1977 Electorate
Turnout %, | Party | Candidate | Votes | % | ±% | | | Conservative | | | % | | | | Labour | | | % | | | | Liberal | | | % | | | | Independent | | | % | | | Majority | | % | | | | Labour gain from Liberal | Swing | | | | | Conservative hold | Swing | | | 6 May 1976 Electorate
Turnout %, | Party | Candidate | Votes | % | ±% | | | Conservative | | | % | | | | Labour | | | % | | | | Liberal | | | % | | | | Independent | | | % | | | Majority | | % | | | | Labour gain from Liberal | Swing | | | | | Conservative hold | Swing | | | 1 May 1975 Electorate
Turnout %, | Party | Candidate | Votes | % | ±% | | | Conservative | | | % | | | | Labour | | | % | | | | Liberal | | | % | | | | Independent | | | % | | | Majority | | % | | | | Labour gain from Liberal | Swing | | | | | Conservative hold | Swing | | | 2 May 1974 Electorate
Turnout %, | Party | Candidate | Votes | % | ±% | | | Conservative | | | % | | | | Labour | | | % | | | | Liberal | | | % | | | | Independent | | | % | | | Majority | | % | | | | Labour gain from Liberal | Swing | | | | | Conservative hold | Swing | | | 3 May 1973 Electorate
Turnout %, | Party | Candidate | Votes | % | ±% | | | Conservative | | | % | | | | Labour | | | % | | | | Liberal | | | % | | | | Independent | | | % | | | Majority | | % | | | | Labour gain from Liberal | Swing | | | | | Conservative hold | Swing | | | 4 May 1972 Electorate
Turnout %, | Party | Candidate | Votes | % | ±% | | | Conservative | | | % | | | | Labour | | | % | | | | Liberal | | | % | | | | Independent | | | % | | | Majority | | % | | | | Labour gain from Liberal | Swing | | | | | Conservative hold | Swing | | | 13 May 1971 Electorate
Turnout %, | Party | Candidate | Votes | % | ±% | | | Conservative | | | % | | | | Labour | | | % | | | | Liberal | | | % | | | | Independent | | | % | | | Majority | | % | | | | Labour gain from Liberal | Swing | | | | | Conservative hold | Swing | | | 7 May 1970 Electorate
Turnout %, | Party | Candidate | Votes | % | ±% | | | Conservative | | | % | | | | Labour | | | % | | | | Liberal | | | % | | | | Independent | | | % | | | Majority | | % | | | | Labour gain from Liberal | Swing | | | | | Conservative hold | Swing | | | 1960s 8 May 1969 Electorate
Turnout %, | Party | Candidate | Votes | % | ±% | | | Conservative | | | % | | | | Labour | | | % | | | | Liberal | | | % | | | | Independent | | | % | | | Majority | | % | | | | Labour gain from Liberal | Swing | | | | | Conservative hold | Swing | | | 9 May 1968 Electorate
Turnout %, | Party | Candidate | Votes | % | ±% | | | Conservative | | | % | | | | Labour | | | % | | | | Liberal | | | % | | | | Independent | | | % | | | Majority | | % | | | | Labour gain from Liberal | Swing | | | | | Conservative hold | Swing | | | 11 May 1967 Electorate
Turnout %, | Party | Candidate | Votes | % | ±% | | | Conservative | | | % | | | | Labour | | | % | | | | Liberal | | | % | | | | Independent | | | % | | | Majority | | % | | | | Labour gain from Liberal | Swing | | | | | Conservative hold | Swing | | | 12 May 1966 Electorate
Turnout %, | Party | Candidate | Votes | % | ±% | | | Conservative | | | % | | | | Labour | | | % | | | | Liberal | | | % | | | | Independent | | | % | | | Majority | | % | | | | Labour gain from Liberal | Swing | | | | | Conservative hold | Swing | | | 13 May 1965 Electorate
Turnout %, | Party | Candidate | Votes | % | ±% | | | Conservative | | | % | | | | Labour | | | % | | | | Liberal | | | % | | | | Independent | | | % | | | Majority | | % | | | | Labour gain from Liberal | Swing | | | | | Conservative hold | Swing | | | 7 May 1964 Electorate
Turnout %, | Party | Candidate | Votes | % | ±% | | | Conservative | | | % | | | | Labour | | | % | | | | Liberal | | | % | | | | Independent | | | % | | | Majority | | % | | | | Labour gain from Liberal | Swing | | | | | Conservative hold | Swing | | | 9 May 1963 Electorate
Turnout %, | Party | Candidate | Votes | % | ±% | | | Conservative | | | % | | | | Labour | | | % | | | | Liberal | | | % | | | | Independent | | | % | | | Majority | | % | | | | Labour gain from Liberal | Swing | | | | | Conservative hold | Swing | | | 10 May 1962 Electorate
Turnout %, | Party | Candidate | Votes | % | ±% | | | Conservative | | | % | | | | Labour | | | % | | | | Liberal | | | % | | | | Independent | | | % | | | Majority | | % | | | | Labour gain from Liberal | Swing | | | | | Conservative hold | Swing | | | 11 May 1961 Electorate
Turnout %, | Party | Candidate | Votes | % | ±% | | | Conservative | | | % | | | | Labour | | | % | | | | Liberal | | | % | | | | Independent | | | % | | | Majority | | % | | | | Labour gain from Liberal | Swing | | | | | Conservative hold | Swing | | | 12 May 1960 Electorate
Turnout %, | Party | Candidate | Votes | % | ±% | | | Conservative | | | % | | | | Labour | | | % | | | | Liberal | | | % | | | | Independent | | | % | | | Majority | | % | | | | Labour gain from Liberal | Swing | | | | | Conservative hold | Swing | | | 1950s 14 May 1959 Electorate
Turnout %, | Party | Candidate | Votes | % | ±% | | | Conservative | | | % | | | | Labour | | | % | | | | Liberal | | | % | | | | Independent | | | % | | | Majority | | % | | | | Labour gain from Liberal | Swing | | | | | Conservative hold | Swing | | | 8 May 1958 Electorate
Turnout %, | Party | Candidate | Votes | % | ±% | | | Conservative | | | % | | | | Labour | | | % | | | | Liberal | | | % | | | | Independent | | | % | | | Majority | | % | | | | Labour gain from Liberal | Swing | | | | | Conservative hold | Swing | | | 9 May 1957 Electorate
Turnout %, | Party | Candidate | Votes | % | ±% | | | Conservative | | | % | | | | Labour | | | % | | | | Liberal | | | % | | | | Independent | | | % | | | Majority | | % | | | | Labour gain from Liberal | Swing | | | | | Conservative hold | Swing | | | 10 May 1956 Electorate
Turnout %, | Party | Candidate | Votes | % | ±% | | | Conservative | | | % | | | | Labour | | | % | | | | Liberal | | | % | | | | Independent | | | % | | | Majority | | % | | | | Labour gain from Liberal | Swing | | | | | Conservative hold | Swing | | | 12 May 1955 Electorate
Turnout %, | Party | Candidate | Votes | % | ±% | | | Conservative | | | % | | | | Labour | | | % | | | | Liberal | | | % | | | | Independent | | | % | | | Majority | | % | | | | Labour gain from Liberal | Swing | | | | | Conservative hold | Swing | | | 13 May 1954 Electorate
Turnout %, | Party | Candidate | Votes | % | ±% | | | Conservative | | | % | | | | Labour | | | % | | | | Liberal | | | % | | | | Independent | | | % | | | Majority | | % | | | | Labour gain from Liberal | Swing | | | | | Conservative hold | Swing | | | 7 May 1953 Electorate
Turnout %, | Party | Candidate | Votes | % | ±% | | | Conservative | | | % | | | | Labour | | | % | | | | Liberal | | | % | | | | Independent | | | % | | | Majority | | % | | | | Labour gain from Liberal | Swing | | | | | Conservative hold | Swing | | | 8 May 1952 Electorate
Turnout %, | Party | Candidate | Votes | % | ±% | | | Conservative | | | % | | | | Labour | | | % | | | | Liberal | | | % | | | | Independent | | | % | | | Majority | | % | | | | Labour gain from Liberal | Swing | | | | | Conservative hold | Swing | | | 10 May 1951 Electorate
Turnout %, | Party | Candidate | Votes | % | ±% | | | Conservative | | | % | | | | Labour | | | % | | | | Liberal | | | % | | | | Independent | | | % | | | Majority | | % | | | | Labour gain from Liberal | Swing | | | | | Conservative hold | Swing | | | 11 May 1950 Electorate
Turnout %, | Party | Candidate | Votes | % | ±% | | | Conservative | | | % | | | | Labour | | | % | | | | Liberal | | | % | | | | Independent | | | % | | | Majority | | % | | | | Labour gain from Liberal | Swing | | | | | Conservative hold | Swing | | | 1940s 12 May 1949 Electorate
Turnout %, | Party | Candidate | Votes | % | ±% | | | Conservative | | | % | | | | Labour | | | % | | | | Liberal | | | % | | | | Independent | | | % | | | Majority | | % | | | | Labour gain from Liberal | Swing | | | | | Conservative hold | Swing | | | 1 November 1947 Electorate
Turnout %, | Party | Candidate | Votes | % | ±% | | | Conservative | | | % | | | | Labour | | | % | | | | Liberal | | | % | | | | Independent | | | % | | | Majority | | % | | | | Labour gain from Liberal | Swing | | | | | Conservative hold | Swing | | | 2 November 1946 Electorate
Turnout %, | Party | Candidate | Votes | % | ±% | | | Conservative | | | % | | | | Labour | | | % | | | | Liberal | | | % | | | | Independent | | | % | | | Majority | | % | | | | Labour gain from Liberal | Swing | | | | | Conservative hold | Swing | | | 3 November 1945 Electorate
Turnout %, | Party | Candidate | Votes | % | ±% | | | Conservative | | | % | | | | Labour | | | % | | | | Liberal | | | % | | | | Independent | | | % | | | Majority | | % | | | | Labour gain from Liberal | Swing | | | | | Conservative hold | Swing | | | |
References
- ^ "Birmingham Ward Population 2011". Retrieved 15 December 2015.
External links
- Birmingham City Council's pages on Stechford and Yardley North Ward
- Stechford Football Club
- Stechford and Yardley North census information
Birmingham UK parliamentary constituencies (left) and city council wards |
| Edgbaston | | |
|---|
| Erdington | |
|---|
| Hall Green | |
|---|
| Hodge Hill | |
|---|
| Ladywood | |
|---|
| Northfield | |
|---|
| Perry Barr | |
|---|
| Selly Oak | |
|---|
| Sutton Coldfield | - Sutton Four Oaks
- Sutton New Hall
- Sutton Trinity
- Sutton Vesey
|
|---|
| Yardley | |
|---|