Timeline of the 1991 Atlantic hurricane season
| Timeline of the 1991 Atlantic hurricane season | |||||||
|---|---|---|---|---|---|---|---|
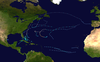
 Season summary map | |||||||
| Season boundaries | |||||||
| First system formed | July 2, 1991 | ||||||
| Last system dissipated | November 2, 1991 | ||||||
| Strongest system | |||||||
| Name | Claudette | ||||||
| Maximum winds | 130 mph (215 km/h) (1-minute sustained) | ||||||
| Lowest pressure | 944 mbar (hPa; 27.88 inHg) | ||||||
| Longest lasting system | |||||||
| Name | Claudette | ||||||
| Duration | 8.25 days | ||||||
| |||||||
| Other years 1989, 1990, 1991, 1992, 1993 | |||||||
The 1991 Atlantic hurricane season was a below-average Atlantic hurricane season that produced twelve tropical cyclones, of which eight strengthened to become named tropical storms; four of these became hurricanes, of which two further intensified into major hurricanes (Category 3 or higher on the Saffir–Simpson scale).[nb 1][2] The season officially began on June 1, 1991, and ended on November 30. These dates, adopted by convention, historically describe the period in each year when most subtropical or tropical cyclogenesis occurs in the Atlantic Ocean.[3] The first system, Tropical Storm Ana, developed on July 2 while the last system, the unnamed Perfect Storm, dissipated on November 2.
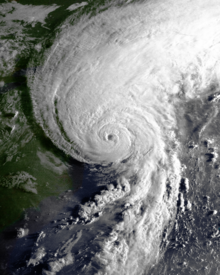
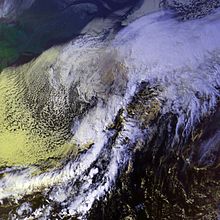
The most destructive storm of the season was Hurricane Bob, which brushed the Outer Banks of North Carolina near peak intensity on August 19, then made landfall twice in Rhode Island later that day.[4] Bob killed at least seventeen people along its path and caused extensive damage in New England, totaling $1.5 billion (1991 USD); this made it one of the ten costliest hurricanes on record for the United States at the time.[5][6] The season's other significant storm was a powerful nor'easter known as the Perfect Storm. It began as an extratropical cyclone off the coast of eastern Nova Scotia late on October 28, being steered southward and then westward by a ridge to its north. Late the following day, the system absorbed Hurricane Grace to its south, contributing to substantial intensification. Its strength and large size created an enormous area of high seas over the western Atlantic Ocean during late October and early November.[2] It caused severe coastal damage in the northeastern United States, with impacts noted as far south as Puerto Rico. Damages exceeded $200 million (1991 USD)[7] and thirteen people were killed.[8] Six of the fatalities occurred when the Andrea Gail and her crew were lost amidst the treacherous conditions; the events surrounding her sinking inspired Sebastian Junger's 1997 book The Perfect Storm, which was adapted into a 2000 film of the same name.[9] As the cyclone executed a counter-clockwise loop south of New England, it gradually acquired tropical characteristics, becoming a minimal hurricane on November 1, and after weakening into a tropical storm, made landfall in Nova Scotia the next day.
This timeline documents tropical cyclone formations, strengthening, weakening, landfalls, extratropical transitions, and dissipations during the season. It includes information that was not released throughout the season, meaning that data from post-storm reviews by the National Hurricane Center, such as a storm that was not initially warned upon, has been included.
By convention, meteorologists use one time zone when issuing forecasts and making observations: Coordinated Universal Time (UTC), and also use the 24-hour clock (where 00:00 = midnight UTC).[10] The National Hurricane Center uses both UTC and the time zone where the center of the tropical cyclone is currently located. The time zones utilized (east to west) prior to 2020 were: Atlantic, Eastern, and Central.[11] In this timeline, all information is listed by UTC first, with the respective regional time zone included in parentheses. Additionally, figures for maximum sustained winds and position estimates are rounded to the nearest five units (knots, miles, or kilometers) and averaged over one minute, following National Hurricane Center practice. Direct wind observations are rounded to the nearest whole number. Atmospheric pressures are listed to the nearest millibar and nearest hundredth of an inch of mercury.
Timeline

June
June 1
- The 1991 Atlantic hurricane season officially begins.[3]
- No storms formed in June.
July
July 2

- 18:00 UTC (2:00 pm EDT) at 31°18′N 79°42′W / 31.3°N 79.7°W / 31.3; -79.7 (Tropical Depression One develops.) – Tropical Depression One develops from a low pressure area centered about 100 mi (155 km) south of Charleston, South Carolina.[12][13]
July 4
- 00:00 UTC (8:00 p.m. EDT, July 3) at 36°12′N 70°42′W / 36.2°N 70.7°W / 36.2; -70.7 (Tropical Depression One strengthens into Tropical Storm Ana.) – Tropical Depression One strengthens into Tropical Storm Ana.[12][13]
- 06:00 UTC (2:00 a.m. EDT) at 37°06′N 67°48′W / 37.1°N 67.8°W / 37.1; -67.8 (Tropical Storm Ana reaches its peak winds.) – Tropical Storm Ana reaches peak winds of 50 mph (85 km/h).[12][13]
- 18:00 UTC (2:00 p.m. EDT) at 37°54′N 61°06′W / 37.9°N 61.1°W / 37.9; -61.1 (Tropical Storm Ana reaches its minimum pressure.) – Tropical Storm Ana reaches a minimum barometric pressure of 1,000 mbar (29.53 inHg).[13]
July 5
- 18:00 UTC (2:00 p.m. AST) – Tropical Storm Ana becomes extratropical over the north-central Atlantic Ocean.[12][13]
- 18:00 UTC (1:00 p.m. CDT) at 23°24′N 96°12′W / 23.4°N 96.2°W / 23.4; -96.2 (Tropical Depression Two develops.) – Tropical Depression Two forms over the western Gulf of Mexico.[14][15]
July 6
- 12:00 UTC (7:00 a.m. CDT) at 23°18′N 97°00′W / 23.3°N 97.0°W / 23.3; -97.0 (Tropical Depression Two reaches its peak winds.) – Tropical Depression Two reaches peak winds of 35 mph (55 km/h).[14]
- 22:00 UTC (5:00 p.m. CDT) at 23°30′N 97°54′W / 23.5°N 97.9°W / 23.5; -97.9 (Tropical Depression Two makes landfall near La Pesca, Mexico.) – Tropical Depression Two makes landfall near La Pesca, Mexico with winds of 35 mph (55 km/h) and a barometric pressure of 1,007 mbar (29.74 inHg).[16]
July 7
- 02:30 UTC (9:30 p.m. CDT, July 6) at 23°30′N 98°18′W / 23.5°N 98.3°W / 23.5; -98.3 (Tropical Depression Two dissipates over Mexico.) – Tropical Depression Two dissipates about 35 mi (55 km) west of La Pesca.[17]
August
August 16
- 00:00 UTC (8:00 p.m. EDT, August 15) at 25°36′N 74°18′W / 25.6°N 74.3°W / 25.6; -74.3 (The season's third tropical depression develops.) – The third tropical depression of the season forms from an area of low pressure about 200 mi (325 km) east of the Bahamian capital of Nassau.[18][19]
- 18:00 UTC (2:00 p.m. EDT) at 26°24′N 75°48′W / 26.4°N 75.8°W / 26.4; -75.8 (The season's third tropical depression strengthens into Tropical Storm Bob.) – The tropical depression strengthens into Tropical Storm Bob about 140 mi (220 km) northeast of Nassau.[18][19]
August 17
- 18:00 UTC (2:00 p.m. EDT) at 29°00′N 77°06′W / 29.0°N 77.1°W / 29.0; -77.1 (Tropical Storm Bob reaches Category 1 intensity.) – Tropical Storm Bob strengthens into a Category 1 hurricane about 235 mi (380 km) east of Daytona Beach, Florida.[18][19]
August 18
- 18:00 UTC (2:00 p.m. EDT) at 33°00′N 76°06′W / 33.0°N 76.1°W / 33.0; -76.1 (Hurricane Bob reaches Category 2 intensity.) – Hurricane Bob strengthens to Category 2 intensity about 265 mi (425 km) south of Norfolk, Virginia.[19]
August 19
- 06:00 UTC (2:00 a.m. EDT) at 36°30′N 74°30′W / 36.5°N 74.5°W / 36.5; -74.5 (Hurricane Bob becomes a Category 3 major hurricane and simultaneously reaches its peak intensity.) – Hurricane Bob strengthens to Category 3 intensity about 105 mi (165 km) east-southeast of Norfolk, Virginia, making it the first major hurricane of the season. It simultaneously reaches peak winds of 115 mph (185 km/h) and a minimum barometric pressure of 950 mbar (28.05 inHg).[19][4]
- 12:00 UTC (8:00 a.m. EDT) at 38°54′N 73°00′W / 38.9°N 73.0°W / 38.9; -73.0 (Hurricane Bob weakens to Category 2 intensity.) – Hurricane Bob weakens to Category 2 intensity about 175 mi (280 km) south-southwest of Block Island, Rhode Island.[19]
- 17:20 UTC (1:20 p.m. EDT) at 41°12′N 71°36′W / 41.2°N 71.6°W / 41.2; -71.6 (Hurricane Bob makes its first landfall on Block Island, Rhode Island.) – Hurricane Bob makes its first landfall on Block Island, Rhode Island with winds of 105 mph (165 km/h) and a barometric pressure of 962 mbar (28.41 inHg).[19][4]
- 18:00 UTC (2:00 p.m. EDT) at 41°24′N 71°24′W / 41.4°N 71.4°W / 41.4; -71.4 (Hurricane Bob makes its second landfall in Newport, Rhode Island.) – Hurricane Bob makes its second landfall in Newport, Rhode Island with winds of 100 mph (155 km/h) and a barometric pressure of 964 mbar (28.47 inHg).[19][4]
August 20
- 00:00 UTC (8:00 p.m. EDT, August 19) at 43°48′N 69°36′W / 43.8°N 69.6°W / 43.8; -69.6 (Hurricane Bob rapidly weakens into a tropical storm.) – Hurricane Bob rapidly weakens over the Gulf of Maine, degrading into a tropical storm while centered about 35 mi (55 km) southwest of Rockland, Maine.[19][4]
- 01:30 UTC (9:30 p.m. EDT, August 19) at 44°06′N 69°06′W / 44.1°N 69.1°W / 44.1; -69.1 (Tropical Storm Bob makes its third landfall near Rockland, Maine.) – Tropical Storm Bob makes its third landfall near Rockland, Maine with winds of 70 mph (110 km/h) and a barometric pressure of 981 mbar (28.97 inHg).[19][4]

- 12:00 UTC (8:00 a.m. EDT) at 47°00′N 65°30′W / 47.0°N 65.5°W / 47.0; -65.5 (Tropical Storm Bob emerges over the Gulf of St. Lawrence.) – Tropical Storm Bob emerges over the Gulf of St. Lawrence near Chatham, New Brunswick.[19][4]
- 18:00 UTC (2:00 p.m. EDT) at 48°24′N 61°54′W / 48.4°N 61.9°W / 48.4; -61.9 (Tropical Storm Bob transitions into an extratropical cyclone.) – Tropical Storm Bob becomes extratropical over the Gulf of St. Lawrence while centered about 190 mi (305 km) east-northeast of Chatham, New Brunswick.[19]
August 24
- 06:00 UTC (2:00 a.m. AST) at 14°30′N 23°06′W / 14.5°N 23.1°W / 14.5; -23.1 (Tropical Depression Four develops.) – Tropical Depression Four forms just to the southeast of Cape Verde.[20]
- 18:00 UTC (2:00 p.m. AST) at 14°54′N 23°54′W / 14.9°N 23.9°W / 14.9; -23.9 (Tropical Depression Four reaches its peak intensity.) – Tropical Depression Four reaches peak winds of 35 mph (55 km/h) and a minimum barometric pressure of 1,009 mbar (29.80 inHg) over southern Cape Verde.[20][21]
August 26
- 06:00 UTC (2:00 a.m. AST) – Tropical Depression Four dissipates.[20]
August 28
- 12:00 UTC (8:00 a.m. AST) at 10°30′N 30°48′W / 10.5°N 30.8°W / 10.5; -30.8 (Tropical Depression Five develops.) – Tropical Depression Five forms from an area of disturbed weather over the eastern Atlantic Ocean.[14][22]
- 18:00 UTC (2:00 p.m. AST) at 10°42′N 32°24′W / 10.7°N 32.4°W / 10.7; -32.4 (Tropical Depression Five reaches its peak winds.) – Tropical Depression Five reaches peak winds of 35 mph (55 km/h).[14]
August 31
- 12:00 UTC (8:00 a.m. AST) at 12°42′N 52°48′W / 12.7°N 52.8°W / 12.7; -52.8 (Tropical Depression Five dissipates.) – Tropical Depression Five dissipates several hundred miles east of the Lesser Antilles.[14][23]
September
September 4
- 12:00 UTC (8:00 a.m. AST) at 26°42′N 55°54′W / 26.7°N 55.9°W / 26.7; -55.9 (A tropical depression develops.) – A tropical depression forms from a non-tropical disturbance about 655 mi (1,055 km) southeast of Bermuda.[24][25]
September 5

- 12:00 UTC (8:00 a.m. AST) at 26°12′N 56°00′W / 26.2°N 56.0°W / 26.2; -56.0 (The tropical depression strengthens into Tropical Storm Claudette.) – The tropical depression strengthens into Tropical Storm Claudette about 675 mi (1,085 km) southeast of Bermuda.[24][25]
September 6
- 12:00 UTC (8:00 a.m. AST) at 26°12′N 58°48′W / 26.2°N 58.8°W / 26.2; -58.8 (Tropical Storm Claudette reaches Category 1 intensity.) – Tropical Storm Claudette strengthens into a Category 1 hurricane about 550 mi (890 km) southeast of Bermuda.[24][25]
- 18:00 UTC (2:00 p.m. AST) at 26°24′N 59°42′W / 26.4°N 59.7°W / 26.4; -59.7 (Hurricane Claudette reaches Category 2 intensity.) – Hurricane Claudette strengthens to Category 2 intensity about 505 mi (815 km) southeast of Bermuda.[24][25]
September 7
- 00:00 UTC (8:00 p.m. AST, September 6) at 26°36′N 60°18′W / 26.6°N 60.3°W / 26.6; -60.3 (Hurricane Claudette becomes a Category 3 major hurricane.) – Hurricane Claudette strengthens to Category 3 intensity about 480 mi (770 km) southeast of Bermuda, making it the second major hurricane of the season.[25]
- 00:00 UTC (8:00 p.m. AST, September 6) at 10°24′N 25°48′W / 10.4°N 25.8°W / 10.4; -25.8 (The season's seventh tropical depression develops.) – The seventh tropical depression of the season forms from a tropical wave about 310 mi (500 km) south-southwest of Brava, Cape Verde.[26][27]
- 10:00 UTC (6:00 a.m. AST) at 27°00′N 61°30′W / 27.0°N 61.5°W / 27.0; -61.5 (Hurricane Claudette, the strongest storm of the season, reaches its peak intensity at Category 4 status.) – Hurricane Claudette strengthens to Category 4 intensity about 415 mi (665 km) south-southeast of Bermuda. It simultaneously reaches peak winds of 130 mph (215 km/h) and a minimum barometric pressure of 944 mbar (27.88 inHg), making it the strongest storm of the season.[25][28]
- 18:00 UTC (2:00 p.m. AST) at 27°42′N 62°24′W / 27.7°N 62.4°W / 27.7; -62.4 (Hurricane Claudette weakens to Category 3 intensity.) – Hurricane Claudette weakens to Category 3 intensity about 350 mi (565 km) south-southeast of Bermuda.[25]
September 8
- 00:00 UTC (8:00 p.m. AST, September 7) at 28°24′N 62°48′W / 28.4°N 62.8°W / 28.4; -62.8 (Hurricane Claudette weakens to Category 2 intensity.) – Hurricane Claudette weakens to Category 2 intensity about 295 mi (475 km) south-southeast of Bermuda.[25]
- 12:00 UTC (8:00 a.m. AST) at 10°18′N 35°00′W / 10.3°N 35.0°W / 10.3; -35.0 (The season's seventh tropical depression strengthens into Tropical Storm Danny.) – The seventh tropical depression of the season strengthens into Tropical Storm Danny about 760 mi (1,225 km) west-southwest of Brava, Cape Verde.[27]
- 18:00 UTC (2:00 p.m. AST) at 31°00′N 63°12′W / 31.0°N 63.2°W / 31.0; -63.2 (Hurricane Claudette weakens to Category 1 intensity.) – Hurricane Claudette weakens to Category 1 intensity about 125 mi (205 km) southeast of Bermuda.[25]
- 18:00 UTC (2:00 p.m. AST) at 24°12′N 49°06′W / 24.2°N 49.1°W / 24.2; -49.1 (Tropical Depression Eight develops.) – Tropical Depression Eight forms from a tropical wave about midway between Hurricane Claudette and Tropical Storm Danny.[29][30]
September 9
- 06:00 UTC (2:00 a.m. AST) at 11°48′N 39°36′W / 11.8°N 39.6°W / 11.8; -39.6 (Tropical Storm Danny reaches its peak winds.) – Tropical Storm Danny reaches peak winds of 50 mph (85 km/h) about 1,020 mi (1,640 km) west-southwest of Brava, Cape Verde.[27]
- 18:00 UTC (2:00 p.m. AST) at 29°18′N 53°06′W / 29.3°N 53.1°W / 29.3; -53.1 (Tropical Depression Eight strengthens into Tropical Storm Erika.) – Tropical Depression Eight strengthens into Tropical Storm Erika about 720 mi (1,160 km) east-southeast of Bermuda.[30]
September 10
- 00:00 UTC (8:00 p.m. AST, September 9) at 14°12′N 45°12′W / 14.2°N 45.2°W / 14.2; -45.2 (Tropical Storm Danny reaches its minimum pressure.) – Tropical Storm Danny reaches a minimum barometric pressure of 998 mbar (29.47 inHg) about 1,075 mi (1,735 km) east of Guadeloupe.[26][27]
- 06:00 UTC (2:00 a.m. AST) at 33°54′N 56°00′W / 33.9°N 56.0°W / 33.9; -56.0 (Hurricane Claudette weakens into a tropical storm.) – Hurricane Claudette weakens into a tropical storm about 520 mi (835 km) east of Bermuda.[25][28]
- 12:00 UTC (8:00 a.m. AST) at 34°42′N 46°06′W / 34.7°N 46.1°W / 34.7; -46.1 (Tropical Storm Erika reaches its peak winds.) – Tropical Storm Erika reaches peak winds of 60 mph (95 km/h) about 1,035 mi (1,670 km) west-southwest of the Azores.[30]
- 18:00 UTC (2:00 p.m. AST) at 35°48′N 42°30′W / 35.8°N 42.5°W / 35.8; -42.5 (Tropical Storm Erika reaches its minimum pressure.) – Tropical Storm Erika reaches a minimum barometric pressure of 997 mbar (29.44 inHg) about 815 mi (1,315 km) west-southwest of the Azores.[30]
September 11
- 12:00 UTC (8:00 a.m. AST) at 16°00′N 58°06′W / 16.0°N 58.1°W / 16.0; -58.1 (Tropical Storm Danny weakens into a tropical depression, and dissipates six hours later.) – Tropical Storm Danny weakens into a tropical depression about 225 mi (360 km) east of Guadeloupe; it dissipates six hours later.[26][27]

- 18:00 UTC (2:00 p.m. AST) at 34°30′N 40°30′W / 34.5°N 40.5°W / 34.5; -40.5 (Tropical Storm Claudette weakens into a tropical depression.) – Tropical Storm Claudette weakens into a tropical depression about 750 mi (1,205 km) west-southwest of the Azores.[25][28]
September 12
- 03:00 UTC (11:00 p.m. AST, September 11) at 37°42′N 25°54′W / 37.7°N 25.9°W / 37.7; -25.9 (Tropical Storm Erika makes landfall on São Miguel in the Azores.) – Tropical Storm Erika makes landfall on the island of São Miguel in the Azores with winds of 40 mph (65 km/h) and a barometric pressure of 1,009 mbar (29.80 inHg).[30]
- 06:00 UTC (2:00 a.m. AST) at 37°54′N 25°12′W / 37.9°N 25.2°W / 37.9; -25.2 (Tropical Storm Erika weakens below gale force around the time of extratropical transition.) – Tropical Storm Erika weakens below gale force; it transitions into an extratropical cyclone within the next six hours.[nb 2]
- 18:00 UTC (2:00 p.m. AST) at 34°18′N 33°06′W / 34.3°N 33.1°W / 34.3; -33.1 (Tropical Depression Claudette transitions into an extratropical cyclone.) – Tropical Depression Claudette becomes extratropical about 410 mi (660 km) southwest of the Azores.[25][28]
October
October 15
- 00:00 UTC (8:00 p.m. EDT, October 14) at 18°54′N 85°42′W / 18.9°N 85.7°W / 18.9; -85.7 (A tropical depression develops.) – A tropical depression forms from an interaction between a cold front and a tropical wave over the northwestern Caribbean Sea.[31][32]
- 12:00 UTC (8:00 a.m. EDT) at 20°18′N 84°06′W / 20.3°N 84.1°W / 20.3; -84.1 (The tropical depression strengthens into Tropical Storm Fabian.) – The tropical depression strengthens into Tropical Storm Fabian about 110 mi (175 km) southwest of the Isle of Youth in Cuba.[31][32]
- 18:00 UTC (2:00 p.m. EDT) at 21°12′N 83°06′W / 21.2°N 83.1°W / 21.2; -83.1 (Tropical Storm Fabian reaches its peak winds.) – Tropical Storm Fabian reaches peak winds of 45 mph (75 km/h) just to the southwest of the Isle of Youth.[32]
- 21:00 UTC (5:00 p.m. EDT) at 21°30′N 82°48′W / 21.5°N 82.8°W / 21.5; -82.8 (Tropical Storm Fabian makes landfall on the Isle of Youth in Cuba.) – Tropical Storm Fabian makes landfall on the Isle of Youth with winds of 45 mph (75 km/h) and a barometric pressure of 1,004 mbar (29.65 inHg).[31][32]
October 16

- 00:00 UTC (8:00 p.m. EDT, October 15) at 22°18′N 81°54′W / 22.3°N 81.9°W / 22.3; -81.9 (Tropical Storm Fabian makes landfall on the Zapata Peninsula in Cuba.) – Tropical Storm Fabian makes landfall on the Zapata Peninsula in Cuba with winds of 45 mph (75 km/h) and a barometric pressure of 1,003 mbar (29.62 inHg).[31][32]
- 08:34 UTC (4:34 a.m. EDT) at 24°30′N 80°30′W / 24.5°N 80.5°W / 24.5; -80.5 (Tropical Storm Fabian reaches its minimum pressure.) – Tropical Storm Fabian reaches a minimum barometric pressure of 1,002 mbar (29.59 inHg) while over the Florida Straits, centered about 105 mi (165 km) north-northeast of Varadero, Cuba.[31][32]
- 18:00 UTC (2:00 p.m. EDT) at 26°30′N 78°30′W / 26.5°N 78.5°W / 26.5; -78.5 (Tropical Storm Fabian transitions into an extratropical cyclone.) – Tropical Storm Fabian transitions into an extratropical cyclone.[31][32]
October 24
- 12:00 UTC (8:00 a.m. AST) at 13°24′N 42°18′W / 13.4°N 42.3°W / 13.4; -42.3 (Tropical Depression Ten develops at its peak intensity.) – Tropical Depression Ten forms from a tropical wave about midway between the Lesser Antilles and the west coast of Africa. It simultaneously reaches peak winds of 30 mph (45 km/h) and a minimum barometric pressure of 1,009 mbar (29.80 inHg).[33]
October 25
- 18:00 UTC (2:00 p.m. AST) – Tropical Depression Ten dissipates.[33]
- 18:00 UTC (2:00 p.m. EDT) at 27°06′N 64°54′W / 27.1°N 64.9°W / 27.1; -64.9 (A subtropical depression develops.) – A subtropical depression forms from a mid-level low-pressure area about 365 mi (585 km) south of Bermuda.[34][35]
October 26
- 06:00 UTC (2:00 a.m. EDT) at 27°12′N 65°30′W / 27.2°N 65.5°W / 27.2; -65.5 (The subtropical depression strengthens into a subtropical storm.) – The subtropical depression strengthens into a subtropical storm about 355 mi (575 km) south of Bermuda.[34][35]
October 27
- 18:00 UTC (1:00 p.m. EST) at 30°48′N 67°12′W / 30.8°N 67.2°W / 30.8; -67.2 (The subtropical storm transitions into Tropical Storm Grace.) – The subtropical storm acquires tropical characteristics and is reclassified as Tropical Storm Grace about 180 mi (295 km) southwest of Bermuda.[34][35]
October 28
- 00:00 UTC (7:00 p.m. EST, October 27) at 31°36′N 68°06′W / 31.6°N 68.1°W / 31.6; -68.1 (Tropical Storm Grace reaches Category 1 intensity.) – Tropical Storm Grace strengthens into a Category 1 hurricane about 200 mi (325 km) west-southwest of Bermuda.[35][36]
October 29
- 00:00 UTC (7:00 p.m. EST, October 28) at 31°48′N 66°48′W / 31.8°N 66.8°W / 31.8; -66.8 (Hurricane Grace reaches its minimum pressure.) – Hurricane Grace reaches a minimum barometric pressure of 980 mbar (28.94 inHg) about 125 mi (205 km) west-southwest of Bermuda.[35]
- 12:00 UTC (8:00 a.m. AST) at 31°30′N 63°12′W / 31.5°N 63.2°W / 31.5; -63.2 (Hurricane Grace reaches Category 2 intensity.) – Hurricane Grace strengthens to Category 2 intensity about 110 mi (175 km) east-southeast of Bermuda.[35]
- 14:00 UTC (10:00 a.m. AST) at 31°30′N 61°48′W / 31.5°N 61.8°W / 31.5; -61.8 (Hurricane Grace reaches its peak winds.) – Hurricane Grace reaches peak winds of 105 mph (165 km/h) about 185 mi (295 km) east-southeast of Bermuda.[35][36]
- 18:00 UTC (2:00 p.m. AST) at 32°30′N 59°00′W / 32.5°N 59.0°W / 32.5; -59.0 (Hurricane Grace transitions into an extratropical cyclone shortly before being absorbed into the Perfect Storm.) – Hurricane Grace becomes extratropical about 335 mi (535 km) east of Bermuda; it is absorbed into a nor'easter, the Perfect Storm, shortly thereafter.[35][36]
October 31
- 18:00 UTC (1:00 p.m. EST) at 36°42′N 71°30′W / 36.7°N 71.5°W / 36.7; -71.5 (The Perfect Storm transitions into a subtropical storm.) – A subtropical storm forms within the center of the Perfect Storm while centered over the Gulf Stream off the United States East Coast.[37][38]
November
November 1
- 06:00 UTC (1:00 a.m. EST) at 36°12′N 68°12′W / 36.2°N 68.2°W / 36.2; -68.2 (The subtropical storm transitions into an unnamed tropical storm.) – The subtropical storm transitions into an unnamed tropical storm over the northwestern Atlantic Ocean.[38][39]
- 18:00 UTC (1:00 p.m. EST) at 38°12′N 66°30′W / 38.2°N 66.5°W / 38.2; -66.5 (The unnamed tropical storm becomes a Category 1 hurricane and simultaneously reaches its peak intensity as a tropical cyclone.) – The unnamed tropical storm strengthens into a Category 1 hurricane about 470 mi (760 km) south-southwest of Halifax, Nova Scotia. It simultaneously reaches its peak intensity as a tropical cyclone, with winds of 75 mph (120 km/h) and a barometric pressure of 980 mbar (28.94 inHg).[38][39]
November 2
- 06:00 UTC (1:00 a.m. EST) at 41°36′N 64°42′W / 41.6°N 64.7°W / 41.6; -64.7 (The unnamed hurricane weakens into a tropical storm.) – The unnamed hurricane weakens into a tropical storm about 220 mi (350 km) south-southwest of Halifax, Nova Scotia.[38]
- 14:00 UTC (9:00 a.m. EST) at 44°36′N 63°30′W / 44.6°N 63.5°W / 44.6; -63.5 (The unnamed tropical storm makes landfall near Halifax, Nova Scotia.) – The unnamed tropical storm makes landfall near Halifax, Nova Scotia with winds of 50 mph (85 km/h) and a barometric pressure of 998 mbar (29.47 inHg).[38][39]
- 18:00 UTC (1:00 p.m. EST) at 46°18′N 62°36′W / 46.3°N 62.6°W / 46.3; -62.6 (The unnamed tropical storm weakens into a tropical depression; it dissipates six hours later.) – The unnamed tropical storm weakens into a tropical depression over eastern Prince Edward Island. It dissipates six hours later after emerging into the Gulf of St. Lawrence.[38][39]
November 30
- The 1991 Atlantic hurricane season officially ends.[3]
Notes
- ^ An average Atlantic hurricane season has fourteen named storms, seven hurricanes, and three major hurricanes.[1]
- ^ In their Preliminary Report for Tropical Storm Erika, the National Hurricane Center stated that Erika became extratropical at 06:00 UTC on September 12, the same time it weakened below tropical storm-force;[30] the Atlantic HURDAT lists Erika as a tropical depression at this time and delays extratropical transition until 12:00 UTC.[14]
See also
 Tropical cyclones portal

- Timeline of the 1991 Pacific hurricane season
- Tropical cyclones in 1991
- Lists of Atlantic hurricanes
References
- ^ "Tropical Cyclone Climatology". Miami, Florida: National Hurricane Center. Archived from the original on February 29, 2024. Retrieved February 17, 2024.
- ^ a b Avila, Lixion; Pasch, Richard (November 1992). "Atlantic Tropical Systems of 1991". Monthly Weather Review. 120 (11). American Meteorological Society: 2688–2696. Bibcode:1992MWRv..120.2688A. doi:10.1175/1520-0493(1992)120<2688:ATSO>2.0.CO;2. ISSN 1520-0493.
- ^ a b c "Hurricanes Frequently Asked Questions". Miami, Florida: Atlantic Oceanographic and Meteorological Laboratory. June 1, 2023. Archived from the original on March 1, 2024. Retrieved June 1, 2023.
- ^ a b c d e f g Mayfield, Max (August 10, 1992). Hurricane Bob Preliminary Report (Page Two) (GIF) (Report). National Hurricane Center. Archived from the original on October 23, 2012. Retrieved February 5, 2024.
- ^ Mayfield, Max (August 10, 1992). "Hurricane Bob Preliminary Report (Page Four)" (GIF). National Hurricane Center. Archived from the original on October 6, 2013. Retrieved January 30, 2024.
- ^ Mayfield, Max (August 10, 1992). "Hurricane Bob Preliminary Report (Page Five)" (GIF). National Hurricane Center. Archived from the original on January 2, 2014. Retrieved January 30, 2024.
- ^ McCown, Sam (August 20, 2008). ""Perfect Storm" Damage Summary" (PDF). National Climatic Data Center. Silver Spring, Maryland: National Oceanic and Atmospheric Administration. Archived (PDF) from the original on September 6, 2021. Retrieved January 30, 2024.
- ^ Wankum, Mike (November 8, 2021). "30th anniversary of 'Perfect Storm' that devastated New England coast". WCVB-TV. Boston, Massachusetts: Hearst Television. Archived from the original on January 30, 2024. Retrieved January 30, 2024.
- ^ McGinnes, Meagan (October 29, 2016). "25 years ago, the crew of the Andrea Gail was lost in the 'perfect storm'". Boston.com. Boston, Massachusetts: Boston Globe Media Partners. Archived from the original on February 19, 2024. Retrieved February 19, 2024.
- ^ "Understanding the Date/Time Stamps". Silver Spring, Maryland: National Oceanic and Atmospheric Administration. Archived from the original on February 26, 2023. Retrieved July 10, 2020.
- ^ "Update on National Hurricane Center Products and Services for 2020" (PDF). Miami, Florida: National Hurricane Center. April 20, 2020. Archived (PDF) from the original on November 28, 2023. Retrieved May 12, 2023.
- ^ a b c d Gerrish, Hal (1991). Tropical Storm Ana Preliminary Report (Page One) (GIF) (Report). National Hurricane Center. Archived from the original on February 28, 2014. Retrieved November 7, 2011.
- ^ a b c d e Gerrish, Hal (1991). Tropical Storm Ana Preliminary Report (Page Three) (GIF) (Report). National Hurricane Center. Archived from the original on February 20, 2014. Retrieved November 7, 2011.
- ^ a b c d e f "Atlantic hurricane best track (HURDAT version 2)" (Database). National Hurricane Center. April 5, 2023. Archived from the original on December 7, 2023. Retrieved March 1, 2024.
 This article incorporates text from this source, which is in the public domain.
 - ^ Rappaport, Edward (July 5, 1991). Tropical Depression Two Advisory Number 1 (Report). National Hurricane Center. Archived from the original on October 25, 2012. Retrieved February 5, 2024.
- ^ Pasch, Richard (July 6, 1991). Tropical Depression Two Advisory Number 5 (Report). National Hurricane Center. Archived from the original on October 25, 2012. Retrieved January 28, 2024.
- ^ Pasch, Richard (July 6, 1991). Tropical Depression Two Public Advisory Number 6 (Report). National Hurricane Center. Archived from the original on October 25, 2012. Retrieved January 28, 2024.
- ^ a b c Mayfield, Max (August 10, 1992). Hurricane Bob Preliminary Report (Page One) (GIF) (Report). National Hurricane Center. Archived from the original on October 23, 2012. Retrieved November 7, 2011.
- ^ a b c d e f g h i j k l Mayfield, Max (August 10, 1992). Hurricane Bob Preliminary Report (Page Eight) (GIF) (Report). National Hurricane Center. Archived from the original on November 7, 2012. Retrieved November 7, 2011.
- ^ a b c Tropical Depression Four Preliminary Report (GIF) (Report). National Hurricane Center. 1991. Archived from the original on February 20, 2014. Retrieved November 7, 2011.
- ^ Avila, Lixion (August 24, 1991). Tropical Depression Four Advisory Number 1 (Report). National Hurricane Center. Archived from the original on February 5, 2024. Retrieved February 5, 2024.
- ^ Rappaport, Edward (August 28, 1991). Tropical Depression Five Discussion Number 1 (Report). National Hurricane Center. Archived from the original on February 27, 2014. Retrieved November 7, 2011.
- ^ Avila, Lixion (August 31, 1991). Tropical Depression Five Advisory Number 13 (Report). National Hurricane Center. Retrieved February 5, 2024.
- ^ a b c d Pasch, Richard (1991). Hurricane Claudette Preliminary Report (Page One) (GIF) (Report). National Hurricane Center. Archived from the original on October 25, 2012. Retrieved November 7, 2011.
- ^ a b c d e f g h i j k l Pasch, Richard (1991). Hurricane Claudette Preliminary Report (Page Five) (GIF) (Report). National Hurricane Center. Archived from the original on October 25, 2012. Retrieved November 7, 2011.
- ^ a b c Mayfield, Max (1991). Tropical Storm Danny Preliminary Report (Page One) (GIF) (Report). National Hurricane Center. Archived from the original on March 1, 2014. Retrieved November 7, 2011.
- ^ a b c d e Mayfield, Max (1991). Tropical Storm Danny Preliminary Report (Page Three) (GIF) (Report). National Hurricane Center. Archived from the original on February 20, 2014. Retrieved November 7, 2011.
- ^ a b c d Pasch, Richard (1991). Hurricane Claudette Preliminary Report (Page Two) (GIF) (Report). National Hurricane Center. Archived from the original on October 25, 2012. Retrieved February 5, 2024.
- ^ Gerrish, Hal (1991). Tropical Storm Erika Preliminary Report (Page One) (GIF) (Report). National Hurricane Center. Archived from the original on March 1, 2014. Retrieved June 13, 2011.
- ^ a b c d e f Gerrish, Hal (1991). Tropical Storm Erika Preliminary Report (Page Three) (GIF) (Report). National Hurricane Center. Archived from the original on February 20, 2014. Retrieved June 13, 2011.
- ^ a b c d e f Avila, Lixion (1991). Tropical Storm Fabian Preliminary Report (Page One) (GIF) (Report). National Hurricane Center. Archived from the original on March 1, 2014. Retrieved November 7, 2011.
- ^ a b c d e f g Avila, Lixion (1991). Tropical Storm Fabian Preliminary Report (Page Three) (GIF) (Report). National Hurricane Center. Archived from the original on February 21, 2014. Retrieved November 7, 2011.
- ^ a b Lawrence, Miles (November 5, 2011). Tropical Depression Ten Preliminary Report (GIF) (Report). National Hurricane Center. Archived from the original on October 23, 2012. Retrieved June 13, 2011.
- ^ a b c Rappaport, Edward (November 13, 1991). Hurricane Grace Preliminary Report (Page One) (GIF) (Report). National Hurricane Center. Archived from the original on September 28, 2013. Retrieved November 7, 2011.
- ^ a b c d e f g h Rappaport, Edward (November 13, 1991). Hurricane Grace Preliminary Report (Page Four) (GIF) (Report). National Hurricane Center. Archived from the original on October 22, 2013. Retrieved November 7, 2011.
- ^ a b c Rappaport, Edward (November 13, 1991). Hurricane Grace Preliminary Report (Page Two) (GIF) (Report). National Hurricane Center. Archived from the original on September 28, 2013. Retrieved November 7, 2011.
- ^ Pasch, Richard. Unnamed Hurricane Preliminary Report (Page One) (GIF) (Report). National Hurricane Center. Archived from the original on October 23, 2012. Retrieved February 6, 2024.
- ^ a b c d e f Pasch, Richard. Unnamed Hurricane Preliminary Report (Page Five) (GIF) (Report). National Hurricane Center. Archived from the original on November 7, 2012. Retrieved October 23, 2012.
- ^ a b c d Pasch, Richard. Unnamed Hurricane Preliminary Report (Page Two) (GIF) (Report). National Hurricane Center. Archived from the original on October 24, 2012. Retrieved February 6, 2024.
External links
Wikimedia Commons has media related to 1991 Atlantic hurricane season.
- National Hurricane Center