Timeline of the 2011 Pacific hurricane season
| Timeline of the 2011 Pacific hurricane season | |||||||
|---|---|---|---|---|---|---|---|
 Season summary map | |||||||
| Season boundaries | |||||||
| First system formed | June 7, 2011 | ||||||
| Last system dissipated | November 25, 2011 | ||||||
| Strongest system | |||||||
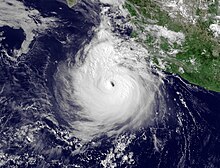
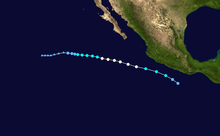
| Name | Dora | ||||||
| Maximum winds | 155 mph (250 km/h) (1-minute sustained) | ||||||
| Lowest pressure | 929 mbar (hPa; 27.43 inHg) | ||||||
| Longest lasting system | |||||||
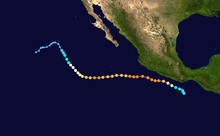
| Name | Irwin | ||||||
| Duration | 10.75 days | ||||||
| |||||||
| Other years 2009, 2010, 2011, 2012, 2013 | |||||||
The 2011 Pacific hurricane season consisted of the events that occurred in the annual cycle of tropical cyclone formation over the Pacific Ocean north of the Equator and east of the International Date Line. The official bounds of each Pacific hurricane season are dates that conventionally delineate the period each year during which tropical cyclones tend to form in the basin according to the National Hurricane Center (NHC), beginning on May 15 in the Eastern Pacific proper (east of 140°W) and June 1 in the Central Pacific (140°W to the International Date Line), and ending on November 30 in both areas. However, tropical cyclogenesis is possible at any time of year.[1] 11 tropical storms developed during the season, which is below the 1991–2020 average of 15 tropical storms.[1] However, all but one became hurricanes and six further strengthened into major hurricanes,[nb 1] eclipsing the 1991–2020 averages of eight hurricanes and four major hurricanes.[1] There were also two tropical depressions that remained below tropical storm status. The first system, Hurricane Adrian, formed on June 7; the final, Hurricane Kenneth, was the latest in a calendar year to exist east of 140°W since 1983, dissipating on November 25.[2]
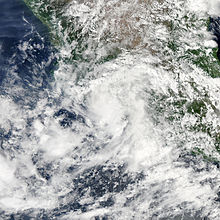
Several tropical cyclones impacted land during the 2011 season. The deadliest was Tropical Depression Twelve-E, which was part of a large area of torrential rains over Central America in mid-October. Widespread and destructive flooding and mudslides occurred in southeastern Mexico and Guatemala; at least 36 fatalities were directly attributed to the tropical depression itself, with many more in Central America being blamed on the overall weather system.[nb 2] On the same day that Twelve-E made landfall, Hurricane Jova came ashore further to the west, in the Mexican state of Jalisco, at Category 2 strength; high winds and heavy rains killed nine people[7] and caused at least MX$2.338 billion (US$187.9 million) in losses.[nb 3] Hurricane Beatriz in June claimed four lives when it passed within 15 mi (30 km) off the Mexican state of Colima, producing strong winds and locally significant flooding on land.[11] Hurricanes Adrian in early June, Dora in July, and Hilary in late September all threatened or brushed the Pacific coast of Mexico but only caused minor peripheral effects.[12][13][14]
Prior to 2015, two time zones were utilized in the Eastern Pacific basin: Pacific east of 140°W, and Hawaii−Aleutian from 140°W to the International Date Line.[15][16] For convenience, each event is listed in Coordinated Universal Time (UTC) first, using the 24-hour clock (where 00:00 = midnight UTC),[17] with the respective local time included in parentheses. Figures for maximum sustained winds and position estimates are rounded to the nearest five units (knots, miles, or kilometers) and averaged over one minute, following National Hurricane Center practice. Direct wind observations are rounded to the nearest whole number. Atmospheric pressures are listed to the nearest millibar and nearest hundredth of an inch of mercury. This timeline documents the formation of tropical cyclones as well as the strengthening, weakening, landfalls, extratropical transitions, and dissipations during the season. It also includes information that was not released while the storm was active, meaning that data from post-storm reviews by the National Hurricane Center and the Central Pacific Hurricane Center is included.
Timeline of events

May
May 15
- The 2011 East Pacific hurricane season officially begins.[1]
June
June 1
- The 2011 Central Pacific hurricane season officially begins.[1]
June 7

- 12:00 UTC (5:00 a.m. PDT) at 11°30′N 99°36′W / 11.5°N 99.6°W / 11.5; -99.6 (A tropical depression develops.) – A tropical depression develops from an area of low pressure about 370 mi (595 km) south of Acapulco, Guerrero.[12]
June 8
- 00:00 UTC (5:00 p.m. PDT, June 7) at 11°42′N 99°54′W / 11.7°N 99.9°W / 11.7; -99.9 (The depression becomes Tropical Storm Adrian.) – The aforementioned tropical depression strengthens into Tropical Storm Adrian about 355 mi (575 km) south of Acapulco, Guerrero.[12]
June 9
- 00:00 UTC (5:00 p.m. PDT, June 8) at 13°30′N 102°00′W / 13.5°N 102.0°W / 13.5; -102.0 (Adrian reaches Category 1 status.) – Tropical Storm Adrian strengthens into a Category 1 hurricane about 270 mi (435 km) south-southwest of Acapulco, Guerrero.[12]
- 12:00 UTC (5:00 a.m. PDT) at 14°06′N 103°36′W / 14.1°N 103.6°W / 14.1; -103.6 (Adrian reaches Category 2 status.) – Hurricane Adrian strengthens to Category 2 intensity about 310 mi (500 km) southwest of Acapulco, Guerrero.[12]
- 18:00 UTC (11:00 a.m. PDT) at 14°18′N 104°24′W / 14.3°N 104.4°W / 14.3; -104.4 (Adrian reaches Category 3 status.) – Hurricane Adrian strengthens to Category 3 intensity about 350 mi (565 km) west-southwest of Acapulco, Guerrero, making it the first major hurricane of the season.[12]
June 10

- 00:00 UTC (5:00 p.m. PDT, June 9) at 14°30′N 105°18′W / 14.5°N 105.3°W / 14.5; -105.3 (Adrian reaches Category 4 status and its highest winds.) – Hurricane Adrian strengthens to Category 4 intensity about 395 mi (640 km) west-southwest of Acapulco, Guerrero; it simultaneously attains peak winds of 140 mph (220 km/h).[12]
- 06:00 UTC (11:00 p.m. PDT, June 9) at 14°48′N 106°12′W / 14.8°N 106.2°W / 14.8; -106.2 (Adrian reaches its lowest pressure.) – Hurricane Adrian attains a minimum barometric pressure of 944 mbar (27.88 inHg) about 445 mi (715 km) west-southwest of Acapulco, Guerrero.[12]
- 18:00 UTC (11:00 a.m. PDT) at 15°24′N 108°06′W / 15.4°N 108.1°W / 15.4; -108.1 (Adrian weakens to Category 3 status.) – Hurricane Adrian weakens to Category 3 intensity about 530 mi (850 km) south-southeast of Cabo San Lucas, Baja California Sur.[12]
June 11
- 06:00 UTC (11:00 p.m. PDT, June 10) at 15°36′N 110°12′W / 15.6°N 110.2°W / 15.6; -110.2 (Adrian rapidly weakens to Category 1 status.) – Hurricane Adrian rapidly weakens to Category 1 intensity, skipping Category 2 status, about 500 mi (805 km) south of Cabo San Lucas, Baja California Sur.[12]
- 18:00 UTC (11:00 a.m. PDT) at 15°36′N 112°24′W / 15.6°N 112.4°W / 15.6; -112.4 (Adrian weakens into a tropical storm.) – Hurricane Adrian weakens into a tropical storm about 530 mi (850 km) south-southwest of Cabo San Lucas, Baja California Sur.[12]
June 12
- 12:00 UTC (5:00 a.m. PDT) at 16°18′N 115°12′W / 16.3°N 115.2°W / 16.3; -115.2 (Adrian becomes post-tropical.) – Tropical Storm Adrian degenerates into a post-tropical cyclone about 570 mi (915 km) southwest of Cabo San Lucas, Baja California Sur.[12]
June 19
- 06:00 UTC (11:00 p.m. PDT, June 18) at 13°06′N 99°00′W / 13.1°N 99.0°W / 13.1; -99.0 (A tropical depression develops.) – A tropical depression develops from an area of low pressure about 265 mi (425 km) south-southeast of Acapulco, Guerrero.[11]
- 18:00 UTC (11:00 a.m. PDT) at 14°06′N 100°42′W / 14.1°N 100.7°W / 14.1; -100.7 (The depression becomes Tropical Storm Beatriz.) – The tropical depression strengthens into Tropical Storm Beatriz about 195 mi (315 km) south-southwest of Acapulco, Guerrero.[11]
June 20
- 18:00 UTC (11:00 a.m. PDT) at 16°42′N 102°54′W / 16.7°N 102.9°W / 16.7; -102.9 (Beatriz reaches Category 1 status.) – Tropical Storm Beatriz strengthens into a Category 1 hurricane about 190 mi (305 km) south-southeast of Manzanillo, Colima.[11]
June 21

- 06:00 UTC (11:00 p.m. PDT, June 20) at 18°30′N 104°00′W / 18.5°N 104.0°W / 18.5; -104.0 (Beatriz reaches its peak intensity as it brushes Mexico.) – Hurricane Beatriz attains peak winds of 90 mph (150 km/h) and a minimum barometric pressure of 977 mbar (28.85 inHg) about 45 mi (75 km) south-southeast of Manzanillo, Colima. Within the next three hours, the eye of Beatriz passes within 15 mi (30 km) of the Pacific coast of Mexico.[11]
- 12:00 UTC (5:00 a.m. PDT) at 19°00′N 105°00′W / 19.0°N 105.0°W / 19.0; -105.0 (Beatriz weakens into a tropical storm.) – Hurricane Beatriz weakens into a tropical storm about 45 mi (75 km) west of Manzanillo, Colima.[11]
June 22
- 00:00 UTC (5:00 p.m. PDT, June 21) at 19°00′N 105°54′W / 19.0°N 105.9°W / 19.0; -105.9 (Beatriz weakens into a tropical depression before dissipating.) – Tropical Storm Beatriz weakens into a tropical depression about 105 mi (165 km) west of Manzanillo, Colima; it dissipates six hours later.[11]
July
July 7
- 12:00 UTC (5:00 a.m. PDT) at 14°48′N 101°24′W / 14.8°N 101.4°W / 14.8; -101.4 (A tropical depression develops.) – A tropical depression develops from an area of low pressure about 175 mi (280 km) southwest of Acapulco, Guerrero.[18]
July 8
- 00:00 UTC (5:00 p.m. PDT, July 7) at 15°42′N 103°54′W / 15.7°N 103.9°W / 15.7; -103.9 (The depression becomes Tropical Storm Calvin.) – The aforementioned tropical depression strengthens into Tropical Storm Calvin about 205 mi (335 km) southwest of Zihuatanejo, Guerrero.[18]
- 18:00 UTC (11:00 a.m. PDT) at 16°30′N 108°06′W / 16.5°N 108.1°W / 16.5; -108.1 (Calvin reaches Category 1 status.) – Tropical Storm Calvin strengthens into a Category 1 hurricane about 305 mi (490 km) southwest of Manzanillo, Colima.[18]
July 9

- 00:00 UTC (5:00 p.m. PDT, July 8) at 16°42′N 109°06′W / 16.7°N 109.1°W / 16.7; -109.1 (Calvin reaches its peak intensity.) – Hurricane Calvin attains peak winds of 80 mph (130 km/h) and a minimum barometric pressure of 984 mbar (29.06 inHg) about 350 mi (565 km) west-southwest of Manzanillo, Colima.[18]
- 12:00 UTC (5:00 a.m. PDT) at 17°06′N 110°48′W / 17.1°N 110.8°W / 17.1; -110.8 (Calvin weakens into a tropical storm.) – Hurricane Calvin weakens into a tropical storm about 270 mi (435 km) east-southeast of Clarion Island.[18]
July 10
- 06:00 UTC (11:00 p.m. PDT, July 9) at 17°48′N 113°06′W / 17.8°N 113.1°W / 17.8; -113.1 (Calvin becomes post-tropical.) – Tropical Storm Calvin degenerates into a post-tropical cyclone about 115 mi (185 km) east-southeast of Clarion Island.[18]
July 18
- 06:00 UTC (11:00 p.m. PDT, July 17) at 10°18′N 90°00′W / 10.3°N 90.0°W / 10.3; -90.0 (A tropical depression develops.) – A tropical depression develops from an area of low pressure about 240 mi (390 km) south-southwest of San Salvador, El Salvador.[13]
- 12:00 UTC (5:00 a.m. PDT) at 10°24′N 91°06′W / 10.4°N 91.1°W / 10.4; -91.1 (The depression becomes Tropical Storm Dora.) – The tropical depression strengthens into Tropical Storm Dora about 260 mi (415 km) south-southwest of San Salvador, El Salvador.[13]

July 19
- 18:00 UTC (11:00 a.m. PDT) at 12°24′N 97°54′W / 12.4°N 97.9°W / 12.4; -97.9 (Dora reaches Category 1 status.) – Tropical Storm Dora strengthens into a Category 1 hurricane about 245 mi (400 km) south-southwest of Puerto Escondido, Oaxaca.[13]
July 20
- 12:00 UTC (5:00 a.m. PDT) at 14°30′N 102°18′W / 14.5°N 102.3°W / 14.5; -102.3 (Dora reaches Category 2 status.) – Hurricane Dora strengthens to Category 2 intensity about 340 mi (545 km) south-southeast of Manzanillo, Colima.[13]
- 18:00 UTC (11:00 a.m. PDT) at 15°06′N 103°36′W / 15.1°N 103.6°W / 15.1; -103.6 (Dora reaches Category 3 status.) – Hurricane Dora strengthens to Category 3 intensity about 275 mi (445 km) south of Manzanillo, Colima, making it the second major hurricane of the season.[13]
July 21
- 00:00 UTC (5:00 p.m. PDT, July 20) at 15°42′N 104°42′W / 15.7°N 104.7°W / 15.7; -104.7 (Dora reaches Category 4 status.) – Hurricane Dora strengthens to Category 4 intensity about 230 mi (370 km) south of Manzanillo, Colima.[13]
- 12:00 UTC (5:00 a.m. PDT) at 16°54′N 106°30′W / 16.9°N 106.5°W / 16.9; -106.5 (Dora, the season's strongest storm, reaches its peak intensity.) – Hurricane Dora attains peak winds of 155 mph (250 km/h) and a minimum barometric pressure of 929 mbar (27.43 inHg) about 205 mi (335 km) southwest of Manzanillo, Colima, making it the strongest storm of the season.[13]
July 22
- 06:00 UTC (11:00 p.m. PDT, July 21) at 18°36′N 108°30′W / 18.6°N 108.5°W / 18.6; -108.5 (Dora rapidly weakens to Category 2 status.) – Hurricane Dora rapidly weakens to Category 2 intensity, skipping Category 3 status, about 275 mi (445 km) west of Manzanillo, Colima.[13]
- 12:00 UTC (5:00 a.m. PDT) at 19°06′N 109°06′W / 19.1°N 109.1°W / 19.1; -109.1 (Dora weakens to Category 1 status.) – Hurricane Dora weakens to Category 1 intensity about 265 mi (425 km) south of the southern tip of the Baja California peninsula.[13]
- 18:00 UTC (11:00 a.m. PDT) at 19°36′N 109°42′W / 19.6°N 109.7°W / 19.6; -109.7 (Dora weakens into a tropical storm.) – Hurricane Dora weakens into a tropical storm about 225 mi (360 km) south of the southern tip of the Baja California peninsula.[13]
July 24
- 12:00 UTC (5:00 a.m. PDT) at 22°54′N 113°54′W / 22.9°N 113.9°W / 22.9; -113.9 (Dora weakens into a tropical depression.) – Tropical Storm Dora weakens into a tropical depression about 255 mi (410 km) west of the southern tip of the Baja California peninsula.[13]
July 25
- 00:00 UTC (5:00 p.m. PDT, July 24) at 24°18′N 114°36′W / 24.3°N 114.6°W / 24.3; -114.6 (Dora becomes a remnant low.) – Tropical Depression Dora degenerates into a remnant low about 310 mi (500 km) west-northwest of the southern tip of the Baja California peninsula.[13]
July 31

- 06:00 UTC (11:00 p.m. PDT, July 30) at 10°30′N 99°24′W / 10.5°N 99.4°W / 10.5; -99.4 (A tropical depression develops.) – A tropical depression develops from an area of low pressure about 445 mi (715 km) south of Acapulco, Guerrero.[19]
- 12:00 UTC (5:00 a.m. PDT) at 10°36′N 100°12′W / 10.6°N 100.2°W / 10.6; -100.2 (The depression becomes Tropical Storm Eugene.) – The tropical depression strengthens into Tropical Storm Eugene about 430 mi (695 km) south of Acapulco, Guerrero.[19]
August
August 1
- 18:00 UTC (11:00 a.m. PDT) at 12°36′N 105°00′W / 12.6°N 105.0°W / 12.6; -105.0 (Eugene reaches Category 1 status.) – Tropical Storm Eugene strengthens into a Category 1 hurricane about 450 mi (725 km) southwest of Acapulco, Guerrero.[19]
August 2
- 18:00 UTC (11:00 a.m. PDT) at 14°00′N 110°06′W / 14.0°N 110.1°W / 14.0; -110.1 (Eugene reaches Category 2 status.) – Hurricane Eugene strengthens to Category 2 intensity about 615 mi (990 km) south of the southern tip of the Baja California peninsula.[19]
August 3

- 06:00 UTC (11:00 p.m. PDT, August 2) at 15°00′N 112°24′W / 15.0°N 112.4°W / 15.0; -112.4 (Eugene reaches Category 3 status.) – Hurricane Eugene strengthens to Category 3 intensity about 565 mi (910 km) south-southwest of the southern tip of the Baja California peninsula, making it the third major hurricane of the season.[19]
- 18:00 UTC (11:00 a.m. PDT) at 15°42′N 114°42′W / 15.7°N 114.7°W / 15.7; -114.7 (Eugene reaches Category 4 status.) – Hurricane Eugene strengthens to Category 4 intensity about 585 mi (935 km) south-southwest of the southern tip of the Baja California peninsula.[19]
- 21:00 UTC (2:00 p.m. PDT) at 15°54′N 115°18′W / 15.9°N 115.3°W / 15.9; -115.3 (Eugene reaches its peak intensity.) – Hurricane Eugene attains peak winds of 140 mph (220 km/h) and a minimum barometric pressure of 942 mbar (27.82 inHg) about 595 mi (955 km) southwest of the southern tip of the Baja California peninsula.[19]
August 4
- 06:00 UTC (11:00 p.m. PDT, August 3) at 16°30′N 117°06′W / 16.5°N 117.1°W / 16.5; -117.1 (Eugene weakens to Category 3 status.) – Hurricane Eugene weakens to Category 3 intensity about 640 mi (1,030 km) southwest of the southern tip of the Baja California peninsula.[19]
- 18:00 UTC (11:00 a.m. PDT) at 17°00′N 119°30′W / 17.0°N 119.5°W / 17.0; -119.5 (Eugene weakens to Category 2 status.) – Hurricane Eugene weakens to Category 2 intensity about 740 mi (1,195 km) southwest of the southern tip of the Baja California peninsula.[19]
August 5
- 00:00 UTC (5:00 p.m. PDT, August 4) at 17°12′N 120°36′W / 17.2°N 120.6°W / 17.2; -120.6 (Eugene weakens to Category 1 status.) – Hurricane Eugene weakens to Category 1 intensity about 795 mi (1,280 km) west-southwest of the southern tip of the Baja California peninsula.[19]
- 12:00 UTC (5:00 a.m. PDT) at 17°48′N 123°00′W / 17.8°N 123.0°W / 17.8; -123.0 (Eugene weakens into a tropical storm.) – Hurricane Eugene weakens into a tropical storm about 915 mi (1,475 km) west-southwest of the southern tip of the Baja California peninsula.[19]
August 6
- 12:00 UTC (5:00 a.m. PDT) at 19°00′N 127°42′W / 19.0°N 127.7°W / 19.0; -127.7 (Eugene becomes post-tropical.) – Tropical Storm Eugene degenerates into a post-tropical cyclone about 1,175 mi (1,890 km) west-southwest of the southern tip of the Baja California peninsula.[19]
August 15
- 18:00 UTC (11:00 a.m. PDT) at 12°06′N 131°48′W / 12.1°N 131.8°W / 12.1; -131.8 (A tropical depression develops.) – A tropical depression develops from an area of low pressure about 1,655 mi (2,670 km) east-southeast of the Big Island of Hawaii.[20]
August 16

- 06:00 UTC (11:00 p.m. PDT, August 15) at 12°12′N 133°24′W / 12.2°N 133.4°W / 12.2; -133.4 (The depression becomes Tropical Storm Fernanda.) – The aforementioned tropical depression strengthens into Tropical Storm Fernanda about 1,555 mi (2,500 km) east-southeast of the Big Island of Hawaii.[20]
- 18:00 UTC (11:00 a.m. PDT) at 13°54′N 99°00′W / 13.9°N 99.0°W / 13.9; -99.0 (A tropical depression develops.) – Another tropical depression develops from an area of low pressure about 215 mi (345 km) south-southeast of Acapulco, Guerrero.[21]
August 17
- 06:00 UTC (11:00 p.m. PDT, August 16) at 15°30′N 101°30′W / 15.5°N 101.5°W / 15.5; -101.5 (The depression becomes Tropical Storm Greg.) – The aforementioned tropical depression strengthens into Tropical Storm Greg about 145 mi (230 km) southwest of Acapulco, Guerrero.[21]
August 18
- 00:00 UTC (5:00 p.m. PDT, August 17) at 17°18′N 107°30′W / 17.3°N 107.5°W / 17.3; -107.5 (Greg reaches Category 1 status.) – Tropical Storm Greg strengthens into a Category 1 hurricane about 245 mi (400 km) south-southwest of Cabo Corrientes, Jalisco.[21]
- 06:00 UTC (11:00 p.m. PDT, August 17) at 12°54′N 139°30′W / 12.9°N 139.5°W / 12.9; -139.5 (Fernanda reaches its peak intensity.) – Tropical Storm Fernanda attains peak winds of 70 mph (110 km/h) and a minimum barometric pressure of 992 mbar (29.29 inHg) about 1,155 mi (1,860 km) east-southeast of the Big Island of Hawaii.[20]
- 12:00 UTC (2:00 a.m. HST) at 13°30′N 140°24′W / 13.5°N 140.4°W / 13.5; -140.4 (Fernanda enters the Central Pacific.) – Tropical Storm Fernanda crosses 140°W, leaving the jurisdiction of the National Hurricane Center and entering the Central Pacific Hurricane Center's area of responsibility.[20]
- 12:00 UTC (5:00 a.m. PDT) at 18°18′N 110°48′W / 18.3°N 110.8°W / 18.3; -110.8 (Greg reaches its peak intensity.) – Hurricane Greg attains peak winds of 85 mph (140 km/h) and a minimum barometric pressure of 979 mbar (28.91 inHg) about 365 mi (585 km) west-southwest of Cabo Corrientes, Jalisco.[21]
August 19
- 12:00 UTC (5:00 a.m. PDT) at 19°18′N 115°30′W / 19.3°N 115.5°W / 19.3; -115.5 (Greg weakens into a tropical storm.) – Hurricane Greg weakens into a tropical storm about 640 mi (1,030 km) west of Cabo Corrientes, Jalisco.[21]
- 18:00 UTC (8:00 a.m. HST) at 15°24′N 145°18′W / 15.4°N 145.3°W / 15.4; -145.3 (Fernanda weakens into a tropical depression.) – Tropical Storm Fernanda weakens into a tropical depression about 730 mi (1,175 km) east-southeast of the Big Island of Hawaii.[20]
August 20
- 00:00 UTC (2:00 p.m. HST, August 19) at 15°30′N 146°30′W / 15.5°N 146.5°W / 15.5; -146.5 (Fernanda becomes a remnant low.) – Tropical Depression Fernanda degenerates into a remnant low about 655 mi (1,055 km) east-southeast of the Big Island of Hawaii.[20]
- 18:00 UTC (11:00 a.m. PDT) at 19°54′N 120°06′W / 19.9°N 120.1°W / 19.9; -120.1 (Greg weakens into a tropical depression.) – Tropical Storm Greg weakens into a tropical depression about 930 mi (1,500 km) west of Cabo Corrientes, Jalisco.[21]
August 21
- 12:00 UTC (5:00 a.m. PDT) at 20°12′N 122°24′W / 20.2°N 122.4°W / 20.2; -122.4 (Greg becomes a remnant low.) – Tropical Depression Greg degenerates into a remnant low about 1,080 mi (1,740 km) west of Cabo Corrientes, Jalisco.[21]
August 31
- 06:00 UTC (11:00 p.m. PDT, August 30) at 17°06′N 101°54′W / 17.1°N 101.9°W / 17.1; -101.9 (Tropical Depression Eight-E develops and reaches its highest winds.) – Tropical Depression Eight-E develops from an area of low pressure about 45 mi (75 km) south-southwest of Zihuatanejo, Guerrero; it simultaneously attains peak winds of 35 mph (55 km/h).[22]
- 12:00 UTC (5:00 a.m. PDT) at 17°42′N 102°24′W / 17.7°N 102.4°W / 17.7; -102.4 (Eight-E reaches its lowest pressure.) – Tropical Depression Eight-E attains a minimum barometric pressure of 1,002 mbar (29.59 inHg) about 60 mi (95 km) west of Zihuatanejo, Guerrero.[22]
- 17:00 UTC (10:00 a.m. PDT) at 18°06′N 102°48′W / 18.1°N 102.8°W / 18.1; -102.8 (Eight-E makes landfall.) – Tropical Depression Eight-E makes landfall near Lázaro Cárdenas, Michoacán, with winds of 35 mph (55 km/h) and a barometric pressure of 1,002 mbar (29.59 inHg).[22]
September
September 1
- 00:00 UTC (5:00 p.m. PDT, August 31) at 18°36′N 103°18′W / 18.6°N 103.3°W / 18.6; -103.3 (Eight-E becomes a remnant low.) – Tropical Depression Eight-E degenerates into a remnant low inland about 85 mi (140 km) west-northwest of Lázaro Cárdenas, Michoacán.[22]
September 21
- 06:00 UTC (11:00 p.m. PDT, September 20) at 13°24′N 96°06′W / 13.4°N 96.1°W / 13.4; -96.1 (A tropical depression develops.) – A tropical depression develops from a tropical wave about 345 mi (555 km) southeast of Acapulco, Guerrero.[14]
- 12:00 UTC (5:00 a.m. PDT) at 13°42′N 96°18′W / 13.7°N 96.3°W / 13.7; -96.3 (The depression becomes Tropical Storm Hilary.) – The tropical depression strengthens into Tropical Storm Hilary about 320 mi (520 km) southeast of Acapulco, Guerrero.[14]
September 22
- 12:00 UTC (5:00 a.m. PDT) at 15°00′N 98°36′W / 15.0°N 98.6°W / 15.0; -98.6 (Hilary reaches Category 1 status.) – Tropical Storm Hilary strengthens into a Category 1 hurricane about 155 mi (250 km) southeast of Acapulco, Guerrero.[14]
- 18:00 UTC (11:00 a.m. PDT) at 15°30′N 99°24′W / 15.5°N 99.4°W / 15.5; -99.4 (Hilary reaches Category 2 status.) – Hurricane Hilary strengthens to Category 2 intensity about 100 mi (155 km) south-southeast of Acapulco, Guerrero.[14]
September 23

- 00:00 UTC (5:00 p.m. PDT, September 22) at 15°54′N 100°18′W / 15.9°N 100.3°W / 15.9; -100.3 (Hilary reaches Category 3 status.) – Hurricane Hilary strengthens to Category 3 intensity about 75 mi (120 km) south-southwest of Acapulco, Guerrero, making it the fourth major hurricane of the season.[14]
- 06:00 UTC (11:00 p.m. PDT, September 22) at 16°00′N 101°18′W / 16.0°N 101.3°W / 16.0; -101.3 (Hilary reaches Category 4 status.) – Hurricane Hilary strengthens to Category 4 intensity about 110 mi (175 km) southwest of Acapulco, Guerrero.[14]
- 18:00 UTC (11:00 a.m. PDT) at 16°12′N 102°42′W / 16.2°N 102.7°W / 16.2; -102.7 (Hilary reaches its peak intensity.) – Hurricane Hilary attains peak winds of 145 mph (230 km/h) and a minimum barometric pressure of 942 mbar (27.82 inHg) about 190 mi (305 km) west-southwest of Acapulco, Guerrero.[14]
September 25
- 06:00 UTC (11:00 p.m. PDT, September 24) at 17°00′N 108°00′W / 17.0°N 108.0°W / 17.0; -108.0 (Hilary weakens to Category 3 status.) – Hurricane Hilary weakens to Category 3 intensity about 425 mi (685 km) south-southeast of the southern tip of the Baja California peninsula.[14]
September 26
- 18:00 UTC (11:00 a.m. PDT) at 16°36′N 113°30′W / 16.6°N 113.5°W / 16.6; -113.5 (Hilary regains Category 4 status and reaches its secondary peak intensity.) – Hurricane Hilary restrengthens to Category 4 intensity about 490 mi (790 km) south-southwest of the southern tip of the Baja California peninsula. It simultaneously attains its secondary peak intensity, with winds of 130 mph (215 km/h) and a barometric pressure of 948 mbar (27.99 inHg).[14]
September 27
- 06:00 UTC (11:00 p.m. PDT, September 26) at 16°36′N 115°18′W / 16.6°N 115.3°W / 16.6; -115.3 (Hilary weakens back to Category 3 status.) – Hurricane Hilary weakens back to Category 3 intensity about 550 mi (890 km) southwest of the southern tip of the Baja California peninsula.[14]
- 18:00 UTC (11:00 a.m. PDT) at 16°54′N 116°54′W / 16.9°N 116.9°W / 16.9; -116.9 (Hilary weakens to Category 2 status.) – Hurricane Hilary weakens to Category 2 intensity about 610 mi (980 km) southwest of the southern tip of the Baja California peninsula.[14]
September 28
- 06:00 UTC (11:00 p.m. PDT, September 27) at 17°36′N 117°48′W / 17.6°N 117.8°W / 17.6; -117.8 (Hilary weakens to Category 1 status.) – Hurricane Hilary weakens to Category 1 intensity about 625 mi (1,010 km) southwest of the southern tip of the Baja California peninsula.[14]
September 29
- 06:00 UTC (11:00 p.m. PDT, September 28) at 19°42′N 119°42′W / 19.7°N 119.7°W / 19.7; -119.7 (Hilary weakens into a tropical storm.) – Hurricane Hilary weakens into a tropical storm about 660 mi (1,065 km) west-southwest of the southern tip of the Baja California peninsula.[14]
September 30
- 06:00 UTC (11:00 p.m. PDT, September 29) at 22°12′N 121°06′W / 22.2°N 121.1°W / 22.2; -121.1 (Hilary weakens into a tropical depression.) – Tropical Storm Hilary weakens into a tropical depression about 715 mi (1,150 km) west of the southern tip of the Baja California peninsula.[14]
- 12:00 UTC (5:00 a.m. PDT) at 22°54′N 121°30′W / 22.9°N 121.5°W / 22.9; -121.5 (Hilary becomes a remnant low.) – Tropical Depression Hilary degenerates into a remnant low about 735 mi (1,185 km) west of the southern tip of the Baja California peninsula.[14]
October
October 6


Track maps of Hurricanes Irwin (top) and Jova (bottom), which developed within six hours of each other
- 00:00 UTC (5:00 p.m. PDT, October 5) at 10°30′N 104°36′W / 10.5°N 104.6°W / 10.5; -104.6 (A tropical depression develops.) – A tropical depression develops from an area of low pressure about 540 mi (870 km) southwest of Acapulco, Guerrero.[7]
- 06:00 UTC (11:00 p.m. PDT, October 5) at 12°06′N 116°00′W / 12.1°N 116.0°W / 12.1; -116.0 (Another tropical depression develops.) – Another tropical depression develops from an area of low pressure about 845 mi (1,360 km) south-southwest of Cabo San Lucas, Baja California Sur.[23]
- 12:00 UTC (5:00 a.m. PDT) at 12°18′N 116°42′W / 12.3°N 116.7°W / 12.3; -116.7 (The newer depression becomes Tropical Storm Irwin.) – The newer tropical depression strengthens into Tropical Storm Irwin about 850 mi (1,370 km) south-southwest of Cabo San Lucas, Baja California Sur.[23]
- 18:00 UTC (11:00 a.m. PDT) at 12°06′N 107°06′W / 12.1°N 107.1°W / 12.1; -107.1 (The older depression becomes Tropical Storm Jova.) – The tropical depression that had formed 18 hours prior strengthens into Tropical Storm Jova about 510 mi (825 km) south-southwest of Manzanillo, Colima.[7]
October 7
- 06:00 UTC (11:00 p.m. PDT, October 6) at 13°18′N 119°18′W / 13.3°N 119.3°W / 13.3; -119.3 (Irwin reaches Category 1 status.) – Tropical Storm Irwin strengthens into a Category 1 hurricane about 905 mi (1,455 km) southwest of Cabo San Lucas, Baja California Sur.[23]
- 18:00 UTC (11:00 a.m. PDT) at 13°48′N 120°30′W / 13.8°N 120.5°W / 13.8; -120.5 (Irwin reaches Category 2 status and its highest winds.) – Hurricane Irwin strengthens to Category 2 intensity about 930 mi (1,500 km) southwest of Cabo San Lucas, Baja California Sur; it simultaneously attains peak winds of 100 mph (155 km/h).[23]
October 8
- 00:00 UTC (5:00 p.m. PDT, October 7) at 13°54′N 120°48′W / 13.9°N 120.8°W / 13.9; -120.8 (Irwin reaches its lowest pressure.) – Hurricane Irwin attains a minimum barometric pressure of 976 mbar (28.82 inHg) about 945 mi (1,520 km) southwest of Cabo San Lucas, Baja California Sur.[23]
- 06:00 UTC (11:00 p.m. PDT, October 7) at 14°06′N 121°00′W / 14.1°N 121.0°W / 14.1; -121.0 (Irwin weakens to Category 1 status.) – Hurricane Irwin weakens to Category 1 intensity about 945 mi (1,520 km) southwest of Cabo San Lucas, Baja California Sur.[23]
- 18:00 UTC (11:00 a.m. PDT) at 15°48′N 110°24′W / 15.8°N 110.4°W / 15.8; -110.4 (Jova reaches Category 1 status.) – Tropical Storm Jova strengthens into a Category 1 hurricane about 460 mi (740 km) west-southwest of Manzanillo, Colima.[7]
- 18:00 UTC (11:00 a.m. PDT) at 14°24′N 120°54′W / 14.4°N 120.9°W / 14.4; -120.9 (Irwin weakens into a tropical storm.) – Hurricane Irwin weakens into a tropical storm about 925 mi (1,490 km) southwest of Cabo San Lucas, Baja California Sur.[23]
October 10

- 00:00 UTC (5:00 p.m. PDT, October 9) at 16°12′N 107°42′W / 16.2°N 107.7°W / 16.2; -107.7 (Jova reaches Category 2 status.) – Hurricane Jova strengthens to Category 2 intensity about 300 mi (480 km) southwest of Manzanillo, Colima.[7]
- 06:00 UTC (11:00 p.m. PDT, October 9) at 16°18′N 107°12′W / 16.3°N 107.2°W / 16.3; -107.2 (Jova reaches Category 3 status.) – Hurricane Jova strengthens to Category 3 intensity about 270 mi (435 km) southwest of Manzanillo, Colima, making it the fifth major hurricane of the season.[7]
- 18:00 UTC (11:00 a.m. PDT) at 16°30′N 106°30′W / 16.5°N 106.5°W / 16.5; -106.5 (Jova reaches its peak intensity.) – Hurricane Jova attains peak winds of 125 mph (205 km/h) and a minimum barometric pressure of 955 mbar (28.20 inHg) about 230 mi (370 km) southwest of Manzanillo, Colima.[7]
October 11
- 12:00 UTC (5:00 a.m. PDT) at 17°30′N 105°42′W / 17.5°N 105.7°W / 17.5; -105.7 (Jova weakens to Category 2 status.) – Hurricane Jova weakens to Category 2 intensity about 140 mi (220 km) southwest of Manzanillo, Colima.[7]
October 12
- 00:00 UTC (5:00 p.m. PDT, October 11) at 13°54′N 93°48′W / 13.9°N 93.8°W / 13.9; -93.8 (Tropical Depression Twelve-E develops and reaches its peak intensity.) – Tropical Depression Twelve-E develops from an area of low pressure about 185 mi (295 km) south-southeast of Salina Cruz, Oaxaca; it simultaneously attains peak winds of 35 mph (55 km/h) and a minimum barometric pressure of 1,004 mbar (29.65 inHg).[3]
- 06:00 UTC (11:00 p.m. PDT, October 11) at 19°36′N 105°06′W / 19.6°N 105.1°W / 19.6; -105.1 (Jova makes landfall.) – Hurricane Jova makes landfall near El Tabaco, Jalisco, or about 40 mi (65 km) northwest of Barra de Navidad, Jalisco, with winds of 100 mph (155 km/h) and a barometric pressure of 975 mbar (28.79 inHg).[7]
- 12:00 UTC (5:00 a.m. PDT) at 20°36′N 104°54′W / 20.6°N 104.9°W / 20.6; -104.9 (Jova rapidly weakens into a tropical storm.) – Hurricane Jova rapidly weakens into a tropical storm, skipping Category 1 status, inland about 100 mi (155 km) north of Barra de Navidad, Jalisco.[7]
- 16:00 UTC (9:00 a.m. PDT) at 16°12′N 94°06′W / 16.2°N 94.1°W / 16.2; -94.1 (Twelve-E makes landfall.) – Tropical Depression Twelve-E makes landfall near Paredón, Chiapas, with winds of 35 mph (55 km/h) and a barometric pressure of 1,005 mbar (29.68 inHg).[3]
- 18:00 UTC (11:00 a.m. PDT) at 21°18′N 104°30′W / 21.3°N 104.5°W / 21.3; -104.5 (Jova weakens into a tropical depression before dissipating.) – Tropical Storm Jova weakens into a tropical depression inland about 145 mi (230 km) north of Barra de Navidad, Jalisco; it dissipates six hours later.[7]

October 13
- 00:00 UTC (5:00 p.m. PDT, October 12) at 17°24′N 108°54′W / 17.4°N 108.9°W / 17.4; -108.9 (Irwin weakens into a tropical depression.) – Tropical Storm Irwin weakens into a tropical depression about 320 mi (520 km) west-southwest of Manzanillo, Colima.[23]
- 00:00 UTC (5:00 p.m. PDT, October 12) at 16°54′N 93°54′W / 16.9°N 93.9°W / 16.9; -93.9 (Twelve-E becomes a remnant low.) – Tropical Depression Twelve-E degenerates into a remnant low inland about 100 mi (155 km) east-northeast of Salina Cruz, Oaxaca.[3]
- 18:00 UTC (11:00 a.m. PDT) at 19°00′N 106°48′W / 19.0°N 106.8°W / 19.0; -106.8 (Irwin regains tropical storm status.) – Tropical Depression Irwin restrengthens into a tropical storm about 160 mi (260 km) west of Manzanillo, Colima.[23]
October 15
- 18:00 UTC (11:00 a.m. PDT) at 15°48′N 106°42′W / 15.8°N 106.7°W / 15.8; -106.7 (Irwin weakens back into a tropical depression.) – Tropical Storm Irwin weakens back into a tropical depression about 275 mi (445 km) southwest of Manzanillo, Colima.[23]
October 16
- 18:00 UTC (11:00 a.m. PDT) at 13°42′N 107°54′W / 13.7°N 107.9°W / 13.7; -107.9 (Irwin becomes a remnant low.) – Tropical Depression Irwin degenerates into a remnant low about 435 mi (705 km) southwest of Manzanillo, Colima.[23]
November

November 19
- 18:00 UTC (10:00 a.m. PST)[nb 4] at 10°06′N 100°42′W / 10.1°N 100.7°W / 10.1; -100.7 (A tropical depression develops.) – A tropical depression develops from an area of low pressure about 470 mi (760 km) south of Acapulco, Guerrero.[26]
November 20
- 18:00 UTC (10:00 a.m. PST) at 11°30′N 105°18′W / 11.5°N 105.3°W / 11.5; -105.3 (The depression becomes Tropical Storm Kenneth.) – The aforementioned tropical depression strengthens into Tropical Storm Kenneth about 520 mi (835 km) southwest of Acapulco, Guerrero.[26]
November 21
- 12:00 UTC (4:00 a.m. PST) at 12°36′N 109°00′W / 12.6°N 109.0°W / 12.6; -109.0 (Kenneth reaches Category 1 status.) – Tropical Storm Kenneth strengthens into a Category 1 hurricane about 450 mi (725 km) south-southeast of Socorro Island.[26]
November 22
- 00:00 UTC (4:00 p.m. PST, November 21) at 13°00′N 111°12′W / 13.0°N 111.2°W / 13.0; -111.2 (Kenneth reaches Category 2 status.) – Hurricane Kenneth strengthens to Category 2 intensity about 395 mi (640 km) south of Socorro Island.[26]
- 06:00 UTC (10:00 p.m. PST, November 21) at 13°00′N 112°18′W / 13.0°N 112.3°W / 13.0; -112.3 (Kenneth reaches Category 3 status.) – Hurricane Kenneth strengthens to Category 3 intensity about 410 mi (660 km) south of Socorro Island, making it the sixth and final major hurricane of the season.[26]
- 12:00 UTC (4:00 a.m. PST) at 12°54′N 113°24′W / 12.9°N 113.4°W / 12.9; -113.4 (Kenneth reaches Category 4 status and its peak intensity.) – Hurricane Kenneth strengthens to Category 4 intensity about 435 mi (705 km) south-southwest of Socorro Island; it simultaneously attains peak winds of 145 mph (230 km/h) and a minimum barometric pressure of 940 mbar (27.76 inHg).[26]
November 23
- 06:00 UTC (10:00 p.m. PST, November 22) at 12°30′N 116°18′W / 12.5°N 116.3°W / 12.5; -116.3 (Kenneth rapidly weakens to Category 2 status.) – Hurricane Kenneth rapidly weakens to Category 2 intensity, skipping Category 3 status, about 420 mi (675 km) south-southwest of Clarion Island.[26]
- 12:00 UTC (4:00 a.m. PST) at 12°42′N 117°18′W / 12.7°N 117.3°W / 12.7; -117.3 (Kenneth weakens to Category 1 status.) – Hurricane Kenneth weakens to Category 1 intensity about 425 mi (685 km) south-southwest of Clarion Island.[26]
- 18:00 UTC (10:00 a.m. PST) at 13°00′N 118°12′W / 13.0°N 118.2°W / 13.0; -118.2 (Kenneth weakens into a tropical storm.) – Hurricane Kenneth weakens into a tropical storm about 435 mi (705 km) south-southwest of Clarion Island.[26]
November 25
- 06:00 UTC (10:00 p.m. PST, November 24) at 13°18′N 124°06′W / 13.3°N 124.1°W / 13.3; -124.1 (Kenneth weakens into a tropical depression.) – Tropical Storm Kenneth weakens into a tropical depression about 715 mi (1,150 km) west-southwest of Clarion Island.[26]
- 12:00 UTC (4:00 a.m. PST) at 13°12′N 125°30′W / 13.2°N 125.5°W / 13.2; -125.5 (Kenneth becomes a remnant low.) – Tropical Depression Kenneth degenerates into a remnant low about 800 mi (1,290 km) west-southwest of Clarion Island.[26]
November 30
- The 2011 Pacific hurricane season officially ends.[1]
Notes
- ^ A major hurricane is a Pacific or Atlantic hurricane that reaches Category 3 or higher on the five-level Saffir–Simpson scale, with maximum sustained winds of at least 111 mph (179 km/h).[1]
- ^ Cited to multiple sources:[3][4][5][6]
- ^ The estimate of monetary losses due to Hurricane Jova was ascertained by combining figures provided by La Jornada – MX$885 million (US$71.1 million) in Jalisco;[8] Notimex – tourism industry losses of MX$170 million (US$13.7 million) in Colima;[9] and El Puerto – infrastructural damages of MX$1.283 billion (US$103.1 million) in Colima.[10]
- ^ On November 6, daylight saving time ended in most areas of the basin, which resulted in the gap between UTC and local time widening by one hour. Hawaii was not affected; the state has not observed daylight saving time since 1945.[24][25]
See also
 Tropical cyclones portal

References
- ^ a b c d e f g "Tropical Cyclone Climatology". Miami, Florida: National Hurricane Center. Archived from the original on April 1, 2024. Retrieved July 16, 2024.
- ^ Blake, Eric S.; Kimberlain, Todd B. (May 1, 2013). "Eastern North Pacific Hurricane Season of 2011". Monthly Weather Review. 141 (5). American Meteorological Society: 1397–1412. Bibcode:2013MWRv..141.1397B. doi:10.1175/MWR-D-12-00192.1.
- ^ a b c d Kimberlain, Todd B. (January 12, 2012). Tropical Cyclone Report: Tropical Depression Twelve-E (PDF) (Report). Miami, Florida: National Hurricane Center. Archived (PDF) from the original on December 5, 2023. Retrieved July 19, 2024.
- ^ "Central America Death Toll at 45 from Heavy Rains". Reuters. Tegucigalpa, Honduras. October 15, 2011. Archived from the original on October 19, 2011. Retrieved July 21, 2024.
- ^ "Suben a 34 los Fallecidos por Lluvias en Centroamérica". El Nacional (in Spanish). Reuters. October 14, 2011. Archived from the original on 2011-10-15. Retrieved July 21, 2024.
- ^ EFE (October 13, 2011). "Cerca de 30 Muertos por Lluvias Que Comienzan a Amainar en Centroamérica" (in Spanish). Univision. Archived from the original on October 26, 2014. Retrieved July 21, 2024.
- ^ a b c d e f g h i j k Brennan, Michael J. (May 18, 2012). Tropical Cyclone Report: Hurricane Jova (PDF) (Report). Miami, Florida: National Hurricane Center. Archived (PDF) from the original on September 30, 2023. Retrieved July 19, 2024.
- ^ García, Juan Carlos (October 18, 2011). "Solicitará Emilio González $885 millones por Jova". La Jornada (in Spanish). Archived from the original on October 8, 2023. Retrieved July 23, 2024.
- ^ "Reportan daños en más de 15 mil hectáreas de cultivos en Colima". Notimex (in Spanish). Noticias. October 14, 2011. Archived from the original on April 1, 2012. Retrieved July 23, 2024.
- ^ Santiago, Marcos (November 4, 2011). "Causó 'Jova' en Colima daños por $1,283 millones de pesos". El Puerto (in Spanish). Archived from the original on July 31, 2012. Retrieved July 23, 2024.
- ^ a b c d e f g Kimberlain, Todd B. (October 27, 2011). Tropical Cyclone Report: Hurricane Beatriz (PDF) (Report). Miami, Florida: National Hurricane Center. Archived (PDF) from the original on March 2, 2024. Retrieved October 27, 2011.
- ^ a b c d e f g h i j k l Berg, Robbie (September 7, 2011). Tropical Cyclone Report: Hurricane Adrian (PDF) (Report). Miami, Florida: National Hurricane Center. Archived (PDF) from the original on December 5, 2023. Retrieved September 10, 2011.
- ^ a b c d e f g h i j k l m Brown, Daniel P. (November 3, 2011). Tropical Cyclone Report: Hurricane Dora (PDF) (Report). Miami, Florida: National Hurricane Center. Archived (PDF) from the original on September 7, 2023. Retrieved July 18, 2024.
- ^ a b c d e f g h i j k l m n o p Beven II, John L.; Landsea, Christopher W. (January 20, 2012). Tropical Cyclone Report: Hurricane Hilary (PDF) (Report). Miami, Florida: National Hurricane Center. Archived (PDF) from the original on October 17, 2022. Retrieved January 20, 2012.
- ^ "NHC Tropical Cyclone Text Product Descriptions". Miami, Florida: National Hurricane Center. Archived from the original on July 10, 2024. Retrieved July 13, 2024.
- ^ "Update on NHC Products and Services for 2015" (PDF). Miami, Florida: National Hurricane Center. March 26, 2015. Archived (PDF) from the original on November 28, 2023. Retrieved July 13, 2024.
- ^ "Understanding the Date/Time Stamps". Silver Spring, Maryland: National Weather Service. Archived from the original on February 26, 2023. Retrieved March 21, 2024.
- ^ a b c d e f Stewart, Stacy R. (November 8, 2011). Tropical Cyclone Report: Hurricane Calvin (PDF) (Report). Miami, Florida: National Hurricane Center. Archived (PDF) from the original on July 15, 2023. Retrieved July 18, 2024.
- ^ a b c d e f g h i j k l Blake, Eric (September 6, 2011). Tropical Cyclone Report: Hurricane Eugene (PDF) (Report). Miami, Florida: National Hurricane Center. Archived (PDF) from the original on August 18, 2023. Retrieved September 20, 2011.
- ^ a b c d e f Pasch, Richard J. (February 3, 2012). Tropical Cyclone Report: Tropical Storm Fernanda (PDF) (Report). Miami, Florida: National Hurricane Center. Archived (PDF) from the original on December 15, 2023. Retrieved July 18, 2024.
- ^ a b c d e f g Avila, Lixion A. (December 22, 2011). Tropical Cyclone Report: Hurricane Greg (PDF) (Report). Miami, Florida: National Hurricane Center. Archived (PDF) from the original on July 15, 2023. Retrieved July 18, 2024.
- ^ a b c d Cangialosi, John P. (October 27, 2011). Tropical Cyclone Report: Tropical Depression Eight-E (PDF) (Report). Miami, Florida: National Hurricane Center. Archived (PDF) from the original on July 7, 2022. Retrieved July 19, 2024.
- ^ a b c d e f g h i j k Berg, Robbie (January 10, 2012). Tropical Cyclone Report: Hurricane Irwin (PDF) (Report). Miami, Florida: National Hurricane Center. Archived (PDF) from the original on January 21, 2022. Retrieved January 13, 2012.
- ^ Handwerk, Brian (March 11, 2011). "Daylight Saving Time 2011: Why and When Does It Begin?". National Geographic. Washington, D.C. Archived from the original on June 28, 2023. Retrieved July 19, 2024.
- ^ Enten, Harry (March 12, 2022). "The Daylight Saving Time debate is nothing to lose sleep over". CNN. Atlanta, Georgia. Archived from the original on March 31, 2024. Retrieved May 13, 2024.
- ^ a b c d e f g h i j k Stewart, Stacy R. (January 14, 2012). Tropical Cyclone Report: Hurricane Kenneth (PDF) (Report). Miami, Florida: National Hurricane Center. Archived (PDF) from the original on September 7, 2023. Retrieved July 19, 2024.
External links
- The National Hurricane Center's main page
- The Central Pacific Hurricane Center's main page


