Timeline of the 2016 Atlantic hurricane season
| Timeline of the 2016 Atlantic hurricane season | |||||||
|---|---|---|---|---|---|---|---|
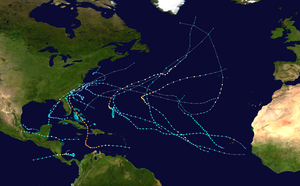 Season summary map | |||||||
| Season boundaries | |||||||
| First system formed | January 12, 2016 | ||||||
| Last system dissipated | November 25, 2016[nb 1] | ||||||
| Strongest system | |||||||
| Name | Matthew | ||||||
| Maximum winds | 165 mph (270 km/h) (1-minute sustained) | ||||||
| Lowest pressure | 934 mbar (hPa; 27.58 inHg) | ||||||
| Longest lasting system | |||||||
| Name | Nicole | ||||||
| Duration | 14 days | ||||||
| |||||||
| Other years 2014, 2015, 2016, 2017, 2018 | |||||||
The 2016 Atlantic hurricane season was an event in the annual tropical cyclone season in the north Atlantic Ocean. It was the costliest, as well as the first above-average, Atlantic hurricane season since the 2012 season.[nb 2] It featured the highest number of deaths since the 2008 season and also yielded the highest number of named storm landfalls on the United States since that year.[3][4] The season officially began on June 1 and concluded on November 30, dates which conventionally delimit the period during each year when a majority of tropical cyclones form in the Atlantic Ocean.[5] The season's first cyclone, Alex, developed on January 12, while the final storm of the season, Otto, closed-out the season by exiting into the Eastern Pacific on November 25, becoming the first Atlantic–Pacific crossover hurricane since Hurricane Cesar–Douglas in 1996.[1]
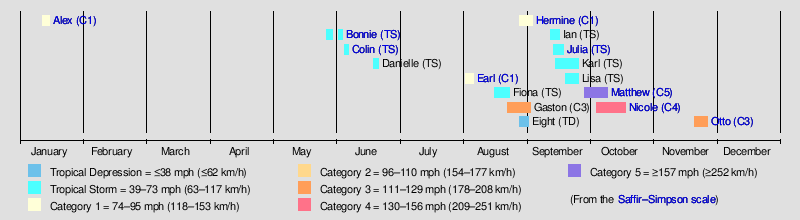
A total of 16 tropical depressions were recorded, of which 15 further intensified into tropical storms. Of those 15, a total of seven strengthened into hurricanes, while four attained their peaks as major hurricanes.[nb 3] Activity began with Alex which, upon making landfall in the Azores, became the first January landfalling tropical cyclone since Hurricane Alice in the 1954 season.[7] In June, tropical storms Colin and Danielle became the earliest third and fourth named storms, respectively, on record.[8][9] Hermine moved ashore the coastline of Florida as a Category 1 hurricane on September 2, ending the record hurricane drought that began in the state after the 2005 season's Hurricane Wilma.[10] In late September and early October, Hurricane Matthew wrought destruction throughout the Caribbean Sea and Southeastern United States, resulting in $15.09 billion (2016 USD) in damage and 603 deaths.[11] In mid-October, Hurricane Nicole developed to Category 4 intensity and remained a major hurricane while directly impacting Bermuda, the first storm of such strength to do so since Hurricane Fabian in the 2003 season.[12] Following the 2016 season, the names Matthew and Otto were retired from reuse in the North Atlantic by the World Meteorological Organization.[13]
This timeline documents tropical cyclone formations, strengthening, weakening, landfalls, extratropical transitions, and dissipations during the season. It includes information that was not released throughout the season, meaning that data from post-storm reviews by the National Hurricane Center, such as a storm that was not initially warned upon, has been included.
By convention, meteorologists use one time zone when issuing forecasts and making observations: Coordinated Universal Time (UTC), and also use the 24-hour clock (where 00:00 = midnight UTC).[14] The National Hurricane Center uses both UTC and the time zone where the center of the tropical cyclone is currently located. The time zones utilized (east to west) prior to 2020 were: Atlantic, Eastern, and Central.[15] In this timeline, all information is listed by UTC first with the respective regional time included in parentheses. Additionally, figures for maximum sustained winds and position estimates are rounded to the nearest 5 units (knots, miles, or kilometers), following the convention used in the National Hurricane Center's products. Direct wind observations are rounded to the nearest whole number. Atmospheric pressures are listed to the nearest millibar and nearest hundredth of an inch of mercury.
Timeline
January
January 12
- 18:00 UTC (2:00 p.m. AST) at 25°06′N 35°54′W / 25.1°N 35.9°W / 25.1; -35.9 (Subtropical Storm Alex develops from an area of low pressure) – Subtropical Storm Alex develops from an area of low pressure about 1,150 mi (1,850 km) west-southwest of the Canary Islands.[16]
January 14
- 06:00 UTC (2:00 a.m. AST) at 29°18′N 29°36′W / 29.3°N 29.6°W / 29.3; -29.6 (Subtropical Storm Alex intensifies into a Category 1 hurricane) – Subtropical Storm Alex attains fully tropical characteristics and intensifies into a Category 1 hurricane, roughly 630 mi (1,015 km) south of the Azores.[16]
- 12:00 UTC (8:00 a.m. AST) at 30°48′N 28°42′W / 30.8°N 28.7°W / 30.8; -28.7 (Hurricane Alex attains its peak intensity) – Hurricane Alex attains its peak intensity with maximum sustained winds of 85 mph (140 km/h) and a minimum barometric pressure of 981 mb (hPa; 28.97 inHg) approximately 460 mi (740 km) south-southwest of the Azores.[16]
January 15
- 12:00 UTC (8:00 a.m. AST) at 38°00′N 27°00′W / 38.0°N 27.0°W / 38.0; -27.0 (Hurricane Alex weakens to a tropical storm) – Hurricane Alex weakens to a tropical storm about 45 mi (75 km) south-southeast of Terceira Island, Azores.[16]
- 13:15 UTC (9:15 a.m. AST) at 38°42′N 27°06′W / 38.7°N 27.1°W / 38.7; -27.1 (Tropical Storm Alex makes landfall on Terceira Island, Azores) – Tropical Storm Alex makes landfall on Terceira Island, Azores, with winds of 65 mph (100 km/h).[16]
- 18:00 UTC (2:00 p.m. AST) at 41°30′N 27°42′W / 41.5°N 27.7°W / 41.5; -27.7 (Tropical Storm Alex transitions into an extratropical cyclone) – Tropical Storm Alex transitions into an extratropical cyclone approximately 190 mi (305 km) north of Terceira Island, Azores.[16]
May
May 27
- 18:00 UTC (2:00 p.m. EDT) at 28°18′N 74°24′W / 28.3°N 74.4°W / 28.3; -74.4 (Tropical Depression Two develops from an area of low pressure) – Tropical Depression Two develops from an area of low pressure about 205 mi (330 km) northeast of Great Abaco, Bahamas.[17]
May 28
- 12:00 UTC (8:00 a.m. EDT) at 30°00′N 78°00′W / 30.0°N 78.0°W / 30.0; -78.0 (Tropical Depression Two intensifies into Tropical Storm Bonnie) – Tropical Depression Two intensifies into Tropical Storm Bonnie roughly 225 mi (360 km) south-southeast of Charleston, South Carolina.[17]
- 18:00 UTC (2:00 p.m. EDT) at 30°42′N 79°06′W / 30.7°N 79.1°W / 30.7; -79.1 (Tropical Storm Bonnie attains its peak winds)& – Tropical Storm Bonnie attains its peak intensity with maximum sustained winds of 45 mph (75 km/h) approximately 250 mi (400 km) southeast of Charleston, South Carolina.[17]

May 29
- 12:00 UTC (8:00 a.m. EDT) at 32°42′N 79°42′W / 32.7°N 79.7°W / 32.7; -79.7 (Tropical Storm Bonnie weakens to a tropical depression) – Tropical Storm Bonnie weakens to a tropical depression about 15 mi (25 km) east of Charleston, South Carolina.[17]
- 12:30 UTC (8:30 a.m. EDT) at 32°48′N 79°48′W / 32.8°N 79.8°W / 32.8; -79.8 (Tropical Depression Bonnie makes landfall with winds of 35 mph (55 km/h)) – Tropical Depression Bonnie makes landfall at Isle of Palms, South Carolina, with winds of 35 mph (55 km/h).[17]
May 30
- 12:00 UTC (8:00 a.m. EDT) at 33°18′N 79°48′W / 33.3°N 79.8°W / 33.3; -79.8 (Tropical Depression Bonnie degenerates into a non-convective remnant low) – Tropical Depression Bonnie degenerates into a non-convective remnant area of low pressure roughly 125 mi (205 km) southwest of Wilmington, North Carolina.[17]
June
June 1
- The 2016 Atlantic hurricane season officially begins.[5]
June 2
- 00:00 UTC (8:00 p.m. EDT, June 1) at 34°06′N 76°00′W / 34.1°N 76.0°W / 34.1; -76.0 (The remnants of Bonnie regenerate into a tropical depression) – The remnants of Bonnie regenerate into a tropical depression about 45 mi (75 km) southeast of Cape Lookout, North Carolina.[17]
June 3
- 00:00 UTC (8:00 p.m. EDT, June 2) at 35°36′N 74°30′W / 35.6°N 74.5°W / 35.6; -74.5 (Tropical Depression Bonnie attains its minimum barometric pressure) – Tropical Depression Bonnie attains a minimum barometric pressure of 1006 mbar (hPa; 29.71 inHg) roughly 65 mi (100 km) east-northeast of Cape Hatteras, North Carolina.[17]
- 12:00 UTC (8:00 a.m. EDT) at 35°54′N 72°36′W / 35.9°N 72.6°W / 35.9; -72.6 (Tropical Depression Bonnie re-intensifies into a tropical storm) – Tropical Depression Bonnie re-intensifies into a tropical storm approximately 160 mi (260 km) east-northeast of Cape Hatteras, North Carolina.[17]
June 4
- 12:00 UTC (8:00 a.m. AST) at 35°36′N 67°18′W / 35.6°N 67.3°W / 35.6; -67.3 (Tropical Storm Bonnie weakens to a tropical depression) – Tropical Storm Bonnie weakens to a tropical depression for a second time about 270 mi (435 km) northwest of Bermuda.[17]

June 5
- 00:00 UTC (8:00 p.m. AST, June 4) at 34°48′N 64°36′W / 34.8°N 64.6°W / 34.8; -64.6 (Tropical Depression Bonnie degenerates into a non-convective remnant area of low pressure) – Tropical Depression Bonnie degenerates into a non-convective remnant area of low pressure for a second time roughly 175 mi (280 km) north of Bermuda.[17]
- 12:00 UTC (7:00 a.m. CDT) at 21°36′N 88°00′W / 21.6°N 88.0°W / 21.6; -88.0 (Tropical Depression Three develops from an area of low pressure) – Tropical Depression Three develops from an area of low pressure approximately 80 mi (130 km) west-northwest of Cancún, Yucatán Peninsula.[18]
- 18:00 UTC (1:00 p.m. CDT) at 22°24′N 87°54′W / 22.4°N 87.9°W / 22.4; -87.9 (Tropical Depression Three intensifies into Tropical Storm Colin) – Tropical Depression Three intensifies into Tropical Storm Colin about 110 mi (175 km) northwest of Cancún, Yucatán Peninsula.[18]
June 7
- 00:00 UTC (7:00 p.m. CDT, June 6) at 29°24′N 84°18′W / 29.4°N 84.3°W / 29.4; -84.3 (Tropical Storm Colin attains its peak intensity) – Tropical Storm Colin attains its peak intensity with maximum sustained winds of 50 mph (85 km/h) and a minimum barometric pressure of 1001 mbar (hPa; 29.56 inHg) roughly 70 mi (110 km) south of Tallahassee, Florida.[18]
- 02:00 UTC (10:00 p.m. EDT, June 6) at 29°48′N 83°36′W / 29.8°N 83.6°W / 29.8; -83.6 (Tropical Storm Colin makes landfall near Keaton Beach, Florida) – Tropical Storm Colin makes landfall near Keaton Beach, Florida, with winds of 50 mph (85 km/h).[18]
- 12:00 UTC (8:00 a.m. EDT) at 33°12′N 78°30′W / 33.2°N 78.5°W / 33.2; -78.5 (Tropical Storm Colin transitions into an extratropical cyclone) – Tropical Storm Colin transitions into an extratropical cyclone approximately 75 mi (120 km) south-southwest of Wilmington, North Carolina.[18]

June 19
- 12:00 UTC (7:00 a.m. CDT) at 19°54′N 94°06′W / 19.9°N 94.1°W / 19.9; -94.1 (Tropical Depression Four develops from an area of low pressure) – Tropical Depression Four develops from an area of low pressure about 145 mi (235 km) east-northeast of Heroica Veracruz, Mexico.[19]
June 20
- 06:00 UTC (1:00 a.m. CDT) at 20°00′N 95°30′W / 20.0°N 95.5°W / 20.0; -95.5 (Tropical Depression Four intensifies into Tropical Storm Danielle) – Tropical Depression Four intensifies into Tropical Storm Danielle roughly 70 mi (110 km) north-northeast of Heroica Veracruz, Mexico.[19]
- 12:00 UTC (7:00 a.m. CDT) at 20°42′N 96°06′W / 20.7°N 96.1°W / 20.7; -96.1 (Tropical Storm Danielle attains its peak intensity) Tropical Storm Danielle attains its peak intensity with maximum sustained winds of 45 mph (75 km/h) and a minimum barometric pressure of 1007 mbar (hPa; 29.74 inHg) approximately 95 mi (155 km) east-southeast of Tamiahua, Mexico.[19]
- 22:00 UTC (5:00 p.m. CDT) at 21°12′N 97°24′W / 21.2°N 97.4°W / 21.2; -97.4 (Tropical Storm Danielle makes landfall) – Tropical Storm Danielle makes landfall near Tamiahua, Mexico, with winds of 40 mph (65 km/h).[19]
June 21
- 00:00 UTC (7:00 p.m. CDT, June 20) at 21°06′N 97°48′W / 21.1°N 97.8°W / 21.1; -97.8 (Tropical Storm Danielle weakens to a tropical depression) – Tropical Storm Danielle weakens to a tropical depression about 25 mi (35 km) southwest of Tamiahua, Mexico.[19]
- 06:00 UTC (1:00 a.m. CDT) at 20°48′N 98°42′W / 20.8°N 98.7°W / 20.8; -98.7 (Tropical Depression Danielle degenerates into a non-convective remnant area of low pressure) – Tropical Depression Danielle degenerates into a remnant area of low pressure roughly 85 mi (140 km) southwest of Tamiahua, Mexico.[19]
July
- No tropical cyclones form in the Atlantic Ocean during the month of July.
August
August 2
- 06:00 UTC (2:00 a.m. EDT) at 16°18′N 77°30′W / 16.3°N 77.5°W / 16.3; -77.5 (Tropical Storm Earl develops from an area of low pressure) – Tropical Storm Earl develops from an area of low pressure about 115 mi (185 km) south of Jamaica.[20]
August 3

- 18:00 UTC (1:00 p.m. CDT) at 16°54′N 85°24′W / 16.9°N 85.4°W / 16.9; -85.4 (Tropical Storm Earl intensifies into a Category 1 hurricane) – Tropical Storm Earl intensifies into a Category 1 hurricane roughly 165 mi (265 km) east-southeast of Turneffe Atoll, Belize.[20]
August 4
- 04:00 UTC (11:00 p.m. CDT, August 3) at 17°24′N 87°48′W / 17.4°N 87.8°W / 17.4; -87.8 (Hurricane Earl attains peak winds and makes its first landfall) – Hurricane Earl] attains its peak intensity with maximum sustained winds of 85 mph (140 km/h) and a minimum barometric pressure of 979 mbar (hPa; 28.91 inHg) and simultaneously makes its first landfall on Turnleffe Caye, Belize.[20]
- 06:00 UTC (1:00 am. CDT) at 17°24′N 88°18′W / 17.4°N 88.3°W / 17.4; -88.3 (Hurricane Earl makes its second landfall) – Hurricane Earl makes its second landfall about 5 mi (10 km) south of Belize City, Belize, with winds of 85 mph (140 km/h).[20]
- 12:00 UTC (7:00 a.m. CDT) at 17°24′N 89°24′W / 17.4°N 89.4°W / 17.4; -89.4 (Hurricane Earl weakens to a tropical storm) – Hurricane Earl weakens to a tropical storm about 80 mi (130 km) west of Belize City, Belize.[20]
August 6
- 02:30 UTC (9:30 p.m. CDT, August 5) at 19°00′N 96°00′W / 19.0°N 96.0°W / 19.0; -96.0 (Tropical Storm Earl makes its third and final landfall) – Tropical Storm Earl makes its third and final landfall about 15 mi (25 km) south-southeast of Heroica Veracruz, Mexico, with winds of 60 mph (95 km/h).[20]
- 12:00 UTC (7:00 a.m. CDT) at 19°00′N 97°30′W / 19.0°N 97.5°W / 19.0; -97.5 (Tropical Storm Earl weakens to a tropical depression) – Tropical Storm Earl weakens to a tropical depression about 30 mi (50 km) northwest of Orizaba, Mexico.[20]
- 18:00 UTC (1:00 p.m. CDT) – Tropical Depression Earl dissipates over Central Mexico.[20]
- 18:00 UTC (1:00 p.m. AST) at 12°00′N 32°12′W / 12.0°N 32.2°W / 12.0; -32.2 (Tropical Depression Six develops from an area of low pressure) – Tropical Depression Six develops from an area of low pressure approximately 715 miles (1,150 km) west-southwest of the Cabo Verde Islands.[21]
August 17

- 12:00 UTC (8:00 a.m. AST) at 13°42′N 36°00′W / 13.7°N 36.0°W / 13.7; -36.0 (Tropical Depression Six intensifies into Tropical Storm Fiona) – Tropical Depression Six intensifies into Tropical Storm Fiona about 920 miles (1,480 km) west of the Cabo Verde Islands.[21]
August 19
- 00:00 UTC (8:00 p.m. AST August 18) at 16°54′N 41°30′W / 16.9°N 41.5°W / 16.9; -41.5 (Tropical Storm Fiona attains its peak intensity) – Tropical Storm Fiona attains its peak intensity with maximum sustained winds of 50 mph (85 km/h) and a minimum barometric pressure of 1004 mbar (hPa; 29.65 inHg) roughly 825 miles (1,330 km) east-northeast of the Leeward Islands.[21]
August 22
- 06:00 UTC (2:00 a.m. AST) at 24°12′N 57°36′W / 24.2°N 57.6°W / 24.2; -57.6 (Tropical Storm Fiona weakens to a tropical depression) – Tropical Storm Fiona weakens to a tropical depression approximately 770 miles (1,240 km) southeast of Bermuda.[21]
- 12:00 UTC (8:00 a.m. AST) at 11°30′N 26°30′W / 11.5°N 26.5°W / 11.5; -26.5 (Tropical Depression Seven develops from an area of low pressure) – Tropical Depression Seven develops from an area of low pressure roughly 305 miles (490 km) southwest of the southernmost Cabo Verde Islands.[22]
- 18:00 UTC (2:00 p.m. AST) at 12°00′N 28°12′W / 12.0°N 28.2°W / 12.0; -28.2 (Tropical Depression Seven intensifies into Tropical Storm Gaston) – Tropical Depression Seven intensifies into Tropical Storm Gaston approximately 310 miles (500 km) southwest of the southernmost Cabo Verde Islands.[22]
August 23
- 12:00 UTC (8:00 a.m. AST) at 25°54′N 64°00′W / 25.9°N 64.0°W / 25.9; -64.0 (Tropical Depression Fiona degenerates into a remnant low) – Tropical Depression Fiona degenerates into a remnant low about 430 miles (690 km) south of Bermuda.[21]
August 24
- 12:00 UTC (8:00 a.m. AST) at 15°48′N 39°06′W / 15.8°N 39.1°W / 15.8; -39.1 (Tropical Storm Gaston intensifies into a Category 1 hurricane) – Tropical Storm Gaston intensifies into a Category 1 hurricane about 965 miles (1,555 km) west of the Cabo Verde Islands.[22]
August 25
- 12:00 UTC (8:00 a.m. AST) at 19°48′N 44°00′W / 19.8°N 44.0°W / 19.8; -44.0 (Hurricane Gaston weakens to a tropical storm) – Hurricane Gaston weakens to a tropical storm roughly 1,325 miles (2,130 km) west-northwest of the Cabo Verde Islands.[22]
August 27
- 18:00 UTC (2:00 p.m. AST) at 28°42′N 53°36′W / 28.7°N 53.6°W / 28.7; -53.6 (Tropical Storm Gaston re-intensifies into a Category 1 hurricane) – Tropical Storm Gaston re-intensifies into a Category 1 hurricane approximately 710 miles (1,145 km) southeast of Bermuda.[22]

August 28
- 12:00 UTC (8:00 a.m. AST) at 30°18′N 54°42′W / 30.3°N 54.7°W / 30.3; -54.7 (Hurricane Gaston intensifies into a Category 2 hurricane) – Hurricane Gaston intensifies into a Category 2 hurricane about 610 miles (980 km) east-southeast of Bermuda.[22]
- 12:00 UTC (8:00 a.m. EDT) at 31°30′N 69°36′W / 31.5°N 69.6°W / 31.5; -69.6 (Tropical Depression Eight develops from an area of low pressure) – Tropical Depression Eight develops from an area of low pressure and simultaneously attains its peak intensity with maximum sustained winds of 35 mph (55 km/h) and a minimum barometric pressure of 1010 mbar (hPa; 29.83 inHg) approximately 405 miles (650 km) southeast of Cape Hatteras, North Carolina.[23]
- 18:00 UTC (2:00 p.m. AST) at 30°30′N 55°00′W / 30.5°N 55.0°W / 30.5; -55.0 (Hurricane Gaston intensifies into a Category 3 hurricane) – Hurricane Gaston intensifies into a Category 3 hurricane roughly 590 miles (950 km) east-southeast of Bermuda.[22]
- 18:00 UTC (2:00 p.m. EDT) at 23°48′N 81°24′W / 23.8°N 81.4°W / 23.8; -81.4 (Tropical Depression Nine develops from an area of low pressure) – Tropical Depression Nine develops from an area of low pressure about 60 miles (95 km) south-southeast of Key West, Florida.[24]
August 29
- 00:00 UTC (8:00 p.m. AST, August 28) at 30°36′N 55°12′W / 30.6°N 55.2°W / 30.6; -55.2 (Hurricane Gaston attains its peak intensity) – Hurricane Gaston attains its peak intensity with maximum sustained winds of 125 mph (195 km/h) and a minimum barometric pressure of 955 mbar (hPa; 28.20 inHg) approximately 575 mi (925 km) east-southeast of Bermuda.[22]
- 12:00 UTC (8:00 a.m. AST) at 30°48′N 55°24′W / 30.8°N 55.4°W / 30.8; -55.4 (Hurricane Gaston weakens to a Category 2 hurricane) – Hurricane Gaston weakens to a Category 2 hurricane about 565 mi (910 km) east-southeast of Bermuda.[22]
August 31
- 00:00 UTC (8:00 p.m. AST, August 30) at 32°42′N 51°30′W / 32.7°N 51.5°W / 32.7; -51.5 (Hurricane Gaston re-intensifies into a Category 3 hurricane) – Hurricane Gaston re-intensifies into a Category 3 hurricane roughly 775 mi (1,245 km) east of Bermuda.[22]
- 06:00 UTC (1:00 a.m. CDT) at 24°24′N 88°00′W / 24.4°N 88.0°W / 24.4; -88.0 (Tropical Depression Nine intensifies into Tropical Storm Hermine) – Tropical Depression Nine intensifies into Tropical Storm Hermine about 240 miles (385 km) north-northwest of Cancún, Mexico.[24]
- 18:00 UTC (2:00 p.m. AST) at 34°30′N 47°54′W / 34.5°N 47.9°W / 34.5; -47.9 (Hurricane Gaston weakens to a Category 2 hurricane) – Hurricane Gaston weakens to a Category 2 hurricane for a second time approximately 985 mi (1,585 km) east-northeast of Bermuda.[22]
September

September 1
- 06:00 UTC (2:00 a.m. AST) – Tropical Depression Eight dissipates roughly 290 miles (465 km) east of Virginia Beach, Virginia.[23]
- 12:00 UTC (8:00 a.m. AST) at 37°06′N 42°00′W / 37.1°N 42.0°W / 37.1; -42.0 (Hurricane Gaston weakens to a Category 1 hurricane) – Hurricane Gaston weakens to a Category 1 hurricane approximately 605 miles (975 km) southwest of the Azores.[22]
- 18:00 UTC (1:00 p.m. CDT) at 27°54′N 85°30′W / 27.9°N 85.5°W / 27.9; -85.5 (Tropical Storm Hermine intensifies into a Category 1 hurricane) – Tropical Storm Hermine intensifies into a Category 1 hurricane about 130 miles (210 km) south-southwest of Apalachicola, Florida.[24]
September 2
- 00:00 UTC (8:00 p.m. EDT, September 1) at 29°00′N 84°48′W / 29.0°N 84.8°W / 29.0; -84.8 (Hurricane Hermine attains peak winds) – Hurricane Hermine attains peak winds of 80 mph (130 km) about 50 miles (85 km) south-southeast of Apalachicola, Florida.[24]
- 05:30 UTC (1:30 a.m. EDT) at 30°06′N 84°06′W / 30.1°N 84.1°W / 30.1; -84.1 (Hurricane Hermine attains its minimum barometric pressure and makes landfall) – Hurricane Hermine attains a minimum barometric pressure of 981 mbar (hPa; 28.97 inHg) and simultaneously makes landfall just east of St. Marks, Florida, with winds of 80 mph (130 km/h).[24]
- 08:00 UTC (4:00 a.m. EDT) at 30°36′N 83°48′W / 30.6°N 83.8°W / 30.6; -83.8 (Hurricane Hermine weakens to a tropical storm) – Hurricane Hermine weakens to a tropical storm about 30 miles (50 km) east-northeast of Tallahassee, Florida.
- 12:00 UTC (8:00 a.m. AST) at 38°54′N 33°00′W / 38.9°N 33.0°W / 38.9; -33.0 (Hurricane Gaston weakens to a tropical storm) – Hurricane Gaston weakens to a tropical storm about 100 miles (160 km) southwest of the Azores.[22]
- 18:00 UTC (2:00 p.m. AST) at 39°18′N 31°12′W / 39.3°N 31.2°W / 39.3; -31.2 (Tropical Storm Gaston degenerates into a remnant low) – Tropical Storm Gaston degenerates into a non-convective remnant area of low pressure over Flores Island, Azores.[22]
September 3
- 12:00 UTC (8:00 a.m. EDT) at 35°48′N 75°30′W / 35.8°N 75.5°W / 35.8; -75.5 (Tropical Storm Hermine transitions into an extratropical cyclone) – Tropical Storm Hermine transitions into an extratropical cyclone over Oregon Inlet, North Carolina.[24]
September 12
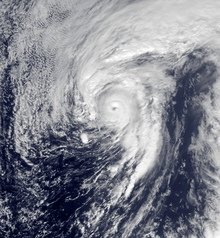
- 06:00 UTC (2:00 a.m. AST) at 20°30′N 49°18′W / 20.5°N 49.3°W / 20.5; -49.3 (Tropical Storm Ian develops from an area of low pressure) – Tropical Storm Ian develops from an area of low pressure about 1,035 miles (1,665 km) southeast of Bermuda.[25]
September 13
- 06:00 UTC (2:00 a.m. EDT) at 27°18′N 80°12′W / 27.3°N 80.2°W / 27.3; -80.2 (A tropical depression develops from an area of low pressure) – A tropical depression develops from an area of low pressure and simultaneously makes landfall near Jensen Beach, Florida, with winds of 35 mph (55 km/h).[26]
- 12:00 UTC (8:00 a.m. EDT) at 28°00′N 80°42′W / 28.0°N 80.7°W / 28.0; -80.7 (The tropical depression intensifies into Tropical Storm Julia) – The tropical depression intensifies into Tropical Storm Julia about 5 miles (10 km) south of June Park, Florida.[26]
- 18:00 UTC (2:00 p.m. EDT) at 29°00′N 81°12′W / 29.0°N 81.2°W / 29.0; -81.2 (Tropical Storm Julia attains its peak winds) – Tropical Storm Julia attains peak winds of 50 mph (85 km/h) about 5 miles (10 km) east-southeast of DeLand, Florida.[26]
September 14

- 06:00 UTC (2:00 a.m. AST) at 16°12′N 23°12′W / 16.2°N 23.2°W / 16.2; -23.2 (Tropical Depression Twelve develops from an area of low pressure) – Tropical Depression Twelve develops from an area of low pressure while centered near the eastern Cabo Verde Islands.[27]
- 18:00 UTC (2:00 p.m. AST) at 32°06′N 53°48′W / 32.1°N 53.8°W / 32.1; -53.8 (Tropical Storm Ian transitions into a subtropical storm) – Tropical Storm Ian transitions into a subtropical storm about 640 miles (970 km) east of Bermuda.[25]
September 15
- 00:00 UTC (8:00 p.m. EDT, September 14) at 31°54′N 80°06′W / 31.9°N 80.1°W / 31.9; -80.1 (Tropical Storm Julia attains its minimum barometric pressure) – Tropical Storm Julia attains a minimum barometric pressure of 1007 mbar (hPa; 29.74 inHg) about 60 miles (95 km) east of Savannah, Georgia.[26]
- 06:00 UTC (2:00 a.m. AST) at 17°30′N 28°42′W / 17.5°N 28.7°W / 17.5; -28.7 (Tropical Depression Twelve intensifies into Tropical Storm Karl) – Tropical Depression Twelve intensifies into Tropical Storm Karl about 225 miles (360 km) west of the Cabo Verde Islands.[27]
- 12:00 UTC (8:00 a.m. AST) at 36°18′N 51°30′W / 36.3°N 51.5°W / 36.3; -51.5 (Subtropical Storm Ian transitions into a tropical storm) – Subtropical Storm Ian transitions into a tropical storm about 800 miles (1,285 km) northeast of Bermuda.[25]
September 16
- 06:00 UTC (2:00 a.m. AST) at 43°12′N 42°54′W / 43.2°N 42.9°W / 43.2; -42.9 (Tropical Storm Ian attains its peak intensity) – Tropical Storm Ian attains its peak intensity with maximum sustained winds of 60 mph (95 km/h) and a minimum barometric pressure of 994 mbar (hPa; 29.36 inHg) about 660 miles (1,060 km) west-northwest of the Azores.[25]
- 12:00 UTC (8:00 a.m. AST) at 46°48′N 38°36′W / 46.8°N 38.6°W / 46.8; -38.6 (Tropical Storm Ian transitions into an extratropical cyclone) – Tropical Storm Ian transitions into an extratropical cyclone about 630 miles (1,015 km) northwest of the Azores.[25]
September 17
- 00:00 UTC (8:00 p.m. EDT, September 16) at 30°24′N 76°00′W / 30.4°N 76.0°W / 30.4; -76.0 (Tropical Storm Julia weakens to a tropical depression) – Tropical Storm Julia weakens to a tropical depression about 325 miles (525 km) east-southeast of Savannah, Georgia.[26]
September 19
- 00:00 UTC (8:00 p.m. EDT, September 18) at 32°12′N 78°18′W / 32.2°N 78.3°W / 32.2; -78.3 (Tropical Depression Julia degenerates into a remnant low) – Tropical Depression Julia degenerates into a non-convective remnant area of low pressure about 90 miles (150 km) southeast of Charleston, South Carolina.[26]
- 12:00 UTC (8:00 a.m. AST) at 13°24′N 27°18′W / 13.4°N 27.3°W / 13.4; -27.3 (Tropical Depression Thirteen develops from an area of low pressure) – Tropical Depression Thirteen develops from an area of low pressure about 225 miles (360 km) west-southwest of the southern Cabo Verde Islands.[28]

September 20
- 12:00 UTC (8:00 a.m. AST) at 15°06′N 30°00′W / 15.1°N 30.0°W / 15.1; -30.0 (Tropical Depression Thirteen intensifies into Tropical Storm Lisa) – Tropical Depression Thirteen intensifies into Tropical Storm Lisa about 355 miles (570 km) west of the southern Cabo Verde Islands.[28]
September 21
- 06:00 UTC (2:00 a.m. AST) at 20°12′N 56°54′W / 20.2°N 56.9°W / 20.2; -56.9 (Tropical Storm Karl weakens to a tropical depression) – Tropical Storm Karl weakens to a tropical depression about 515 miles (830 km) north of Barbados.[27]
September 22
- 12:00 UTC (8:00 a.m. AST) at 19°42′N 33°48′W / 19.7°N 33.8°W / 19.7; -33.8 (Tropical Storm Lisa attains its peak intensity) – Tropical Storm Lisa attains its peak intensity with maximum sustained winds of 50 mph (85 km/h) and a minimum barometric pressure of 999 mbar (hPa; 29.50 inHg) about 585 miles (940 km) west-northwest of the Cabo Verde Islands.[28]
- 18:00 UTC (2:00 p.m. AST) at 25°18′N 62°54′W / 25.3°N 62.9°W / 25.3; -62.9 (Tropical Depression Karl re-intensifies into a tropical storm) – Tropical Depression Karl re-intensifies into a tropical storm about 490 miles (790 km) south-southeast of Bermuda.[27]
September 23
- 18:00 UTC (2:00 p.m. AST) at 29°12′N 65°18′W / 29.2°N 65.3°W / 29.2; -65.3 (Tropical Storm Karl attains its minimum barometric pressure) – Tropical Storm Karl attains a minimum barometric pressure of 988 mbar (hPa; 29.18 inHg) about 210 miles (340 km) south of Bermuda.[27]

September 25
- 00:00 UTC (8:00 p.m. AST, September 24) at 25°24′N 40°24′W / 25.4°N 40.4°W / 25.4; -40.4 (Tropical Storm Lisa weakens to a tropical depression) – Tropical Storm Lisa weakens to a tropical depression about 1,125 miles (1,810 km) northwest of the Cabo Verde Islands.[28]
- 06:00 UTC (2:00 a.m. AST) at 35°48′N 55°06′W / 35.8°N 55.1°W / 35.8; -55.1 (Tropical Storm Karl attains its peak winds) – Tropical Storm Karl attains peak winds of 70 mph (110 km/h) about 605 miles (975 km) northeast of Bermuda.[27]
- 06:00 UTC (2:00 a.m. AST) at 26°30′N 41°24′W / 26.5°N 41.4°W / 26.5; -41.4 (Tropical Depression Lisa degenerates into a remnant low) – Tropical Depression Lisa degenerates into a non-convective remnant area of low pressure about 1,220 miles (1,965 km) northwest of the Cabo Verde Islands.[28]
- 12:00 UTC (8:00 a.m. AST) at 38°06′N 50°24′W / 38.1°N 50.4°W / 38.1; -50.4 (Tropical Storm Karl transitions into an extratropical cyclone) – Tropical Storm Karl transitions into an extratropical cyclone about 905 miles (1,455 km) northeast of Bermuda.[27]
September 28
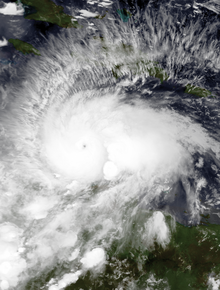
- 12:00 UTC (8:00 a.m. AST) at 13°24′N 59°48′W / 13.4°N 59.8°W / 13.4; -59.8 (Tropical Storm Matthew develops from an area of low pressure) – Tropical Storm Matthew develops from an area of low pressure about 15 miles (25 km) west-northwest of Barbados.[11]
September 29
- 18:00 UTC (2:00 p.m. AST) at 14°12′N 66°54′W / 14.2°N 66.9°W / 14.2; -66.9 (Tropical Storm Matthew intensifies into a Category 1 hurricane) – Tropical Storm Matthew intensifies into a Category 1 hurricane approximately 190 miles (300 km) northeast of Curaçao.[11]
September 30
- 06:00 UTC (2:00 a.m. AST) at 14°00′N 69°18′W / 14.0°N 69.3°W / 14.0; -69.3 (Hurricane Matthew rapidly intensifies into a Category 2 hurricane) – Hurricane Matthew rapidly intensifies into a Category 2 hurricane about 115 miles (185 km) north of Curaçao.[11]
- 12:00 UTC (8:00 a.m. AST) at 13°48′N 70°24′W / 13.8°N 70.4°W / 13.8; -70.4 (Hurricane Matthew rapidly intensifies into a Category 3 hurricane) – Hurricane Matthew rapidly intensifies into a Category 3 hurricane about 85 miles (145 km) north-northwest of Aruba.[11]
- 18:00 UTC (2:00 p.m. EDT) at 13°30′N 71°12′W / 13.5°N 71.2°W / 13.5; -71.2 (Hurricane Matthew rapidly intensifies into a Category 4 hurricane) – Hurricane Matthew rapidly intensifies into a Category 4 hurricane about 100 miles (160 km) northwest of Aruba.[11]
October
October 1
- 00:00 UTC (8:00 p.m. EDT, September 30) at 13°24′N 71°54′W / 13.4°N 71.9°W / 13.4; -71.9 (Hurricane Matthew rapidly intensifies into a Category 5 hurricane and simultaneously attains its peak winds) – Hurricane Matthew rapidly intensifies into a Category 5 hurricane and simultaneously attains peak winds of 165 mph (270 km/h) about 135 miles (215 km) west-northwest of Aruba.[11]
- 12:00 UTC (8:00 a.m. EDT) at 13°24′N 73°06′W / 13.4°N 73.1°W / 13.4; -73.1 (Hurricane Matthew weakens to a Category 4 hurricane) – Hurricane Matthew weakens to a Category 4 hurricane about 400 miles (645 km) southeast of Kingston, Jamaica.[11]
October 4
- 00:00 UTC (8:00 p.m. EDT, October 3) at 16°36′N 74°36′W / 16.6°N 74.6°W / 16.6; -74.6 (Hurricane Matthew attains its minimum barometric pressure) – Hurricane Matthew attains a minimum barometric pressure of 934 mbar (hPa; 27.58 inHg) about 175 miles (280 km) southeast of Kingston, Jamaica.[11]
- 06:00 UTC (2:00 a.m. AST) at 23°12′N 59°48′W / 23.2°N 59.8°W / 23.2; -59.8 (Tropical Storm Nicole develops from an area of low pressure) – Tropical Storm Nicole develops from an area of low pressure about 530 mi (855 km) northeast of San Juan, Puerto Rico.[12]
- 11:00 UTC (7:00 a.m. EDT) at 18°18′N 74°18′W / 18.3°N 74.3°W / 18.3; -74.3 (Hurricane Matthew makes its first landfall) – Hurricane Matthew makes its first landfall near Les Anglais, Haiti, with winds of 150 mph (240 km/h).[11]
October 5
- 00:00 UTC (8:00 p.m. EDT, October 4) at 20°06′N 74°18′W / 20.1°N 74.3°W / 20.1; -74.3 (Hurricane Matthew makes its second landfall) – Hurricane Matthew makes its second landfall near Juaco, Cuba, with winds of 130 mph (210 km/h).[11]
- 06:00 UTC (2:00 a.m. EDT) at 20°42′N 74°24′W / 20.7°N 74.4°W / 20.7; -74.4 (Hurricane Matthew weakens to a Category 3 hurricane) – Hurricane Matthew weakens to a Category 3 hurricane about 355 miles (570 km) southeast of Nassau, Bahamas.[11]
October 6
- 12:00 UTC (8:00 a.m. EDT) at 24°42′N 77°30′W / 24.7°N 77.5°W / 24.7; -77.5 (Hurricane Matthew re-intensifies into a Category 4 hurricane) – Hurricane Matthew re-intensifies into a Category 4 hurricane about 25 miles (40 km) south-southwest of Nassau, Bahamas.[11]
- 18:00 UTC (2:00 p.m. AST) at 27°18′N 65°06′W / 27.3°N 65.1°W / 27.3; -65.1 (Tropical Storm Nicole intensifies into a Category 1 hurricane) – Tropical Storm Nicole intensifies into a Category 1 hurricane about 345 mi (555 km) south of Bermuda.[12]
October 7
- 00:00 UTC (8:00 p.m. EDT, October 6) at 26°42′N 79°00′W / 26.7°N 79.0°W / 26.7; -79.0 (Hurricane Matthew makes its third landfall) – Hurricane Matthew makes its third landfall near West End, Grand Bahama, with winds of 130 mph (210 km/h).[11]
- 00:00 UTC (8:00 p.m. AST, October 6) at 27°30′N 65°12′W / 27.5°N 65.2°W / 27.5; -65.2 (Hurricane Nicole intensifies into a Category 2 hurricane) – Hurricane Nicole intensifies into a Category 2 hurricane about 330 mi (530 km) south of Bermuda.[12]
- 06:00 UTC (2:00 a.m. EDT) at 27°42′N 79°42′W / 27.7°N 79.7°W / 27.7; -79.7 (Hurricane Matthew weakens to a Category 3 hurricane for a second time) – Hurricane Matthew weakens to a Category 3 hurricane for a second time about 45 miles (75 km) east of Vero Beach, Florida.[11]
- 06:00 UTC (2:00 a.m. AST) at 27°36′N 65°12′W / 27.6°N 65.2°W / 27.6; -65.2 (Hurricane Nicole weakens to a Category 1 hurricane) – Hurricane Nicole weakens to a Category 1 hurricane about 320 mi (515 km) south of Bermuda.[12]
- 12:00 UTC (8:00 a.m. AST) at 27°36′N 65°12′W / 27.6°N 65.2°W / 27.6; -65.2 (Hurricane Nicole weakens to a tropical storm) – Hurricane Nicole weakens to a tropical storm about 320 mi (515 km) south of Bermuda.[12]
October 8
- 00:00 UTC (8:00 p.m. EDT, October 7) at 30°42′N 80°36′W / 30.7°N 80.6°W / 30.7; -80.6 (Hurricane Matthew weakens to a Category 2 hurricane) – Hurricane Matthew weakens to a Category 2 hurricane about 70 miles (110 km) northeast of Jacksonville, Florida.[11]
- 12:00 UTC (8:00 a.m. EDT) at 32°30′N 79°54′W / 32.5°N 79.9°W / 32.5; -79.9 (Hurricane Matthew weakens to a Category 1 hurricane) – Hurricane Matthew weakens to a Category 1 hurricane about 20 miles (30 km) south of Charleston, South Carolina.[11]
- 15:00 UTC (11:00 a.m. EDT) at 33°00′N 79°30′W / 33.0°N 79.5°W / 33.0; -79.5 (Hurricane Matthew makes its fourth and final landfall) – Hurricane Matthew makes its fourth and final landfall about 5 miles (10 km) south of McClellanville, South Carolina, with winds of 85 mph (140 km/h).[11]

October 9
- 12:00 UTC (8:00 a.m. EDT) at 35°00′N 74°30′W / 35.0°N 74.5°W / 35.0; -74.5 (Hurricane Matthew transitions into an extratropical cyclone) – Hurricane Matthew transitions into an extratropical cyclone about 60 miles (95 km) east of Cape Hatteras, North Carolina.[11]
October 11
- 18:00 UTC (2:00 p.m. AST) at 27°12′N 66°12′W / 27.2°N 66.2°W / 27.2; -66.2 (Tropical Storm Nicole re-intensifies into a Category 1 hurricane) – Tropical Storm Nicole re-intensifies into a Category 1 hurricane about 355 mi (570 km) south-southwest of Bermuda.[12]
October 12
- 06:00 UTC (2:00 a.m. AST) at 27°36′N 66°48′W / 27.6°N 66.8°W / 27.6; -66.8 (Hurricane Nicole re-intensifies into a Category 2 hurricane) – Hurricane Nicole re-intensifies into a Category 2 hurricane about 340 mi (545 km) south-southwest of Bermuda.[12]
- 18:00 UTC (2:00 p.m. AST) at 28°42′N 66°48′W / 28.7°N 66.8°W / 28.7; -66.8 (Hurricane Nicole intensifies into a Category 3 hurricane) – Hurricane Nicole intensifies into a Category 3 hurricane about 270 mi (435 km) south of Bermuda.[12]
October 13
- 00:00 UTC (8:00 p.m. AST, October 12) at 29°36′N 66°30′W / 29.6°N 66.5°W / 29.6; -66.5 (Hurricane Nicole intensifies into a Category 4 hurricane) – Hurricane Nicole intensifies into a Category 4 hurricane about 205 mi (330 km) south-southwest of Bermuda.[12]
- 06:00 UTC (2:00 a.m. AST) at 30°36′N 66°12′W / 30.6°N 66.2°W / 30.6; -66.2 (Hurricane Nicole attains its peak intensity) – Hurricane Nicole attains its peak intensity with maximum sustained winds of 140 mph (220 km/h) and a minimum barometric pressure of 950 mbar (hPa; 28.06 inHg) about 135 mi (215 km) south-southwest of Bermuda.[12]
- 12:00 UTC (8:00 a.m. AST) at 31°36′N 65°18′W / 31.6°N 65.3°W / 31.6; -65.3 (Hurricane Nicole weakens to a Category 3 hurricane) – Hurricane Nicole weakens to a Category 3 hurricane about 50 mi (85 km) south-southwest of Bermuda.[12]
- 18:00 UTC (2:00 p.m. AST) at 33°00′N 63°54′W / 33.0°N 63.9°W / 33.0; -63.9 (Hurricane Nicole weakens to a Category 2 hurricane) – Hurricane Nicole weakens to a Category 2 hurricane about 65 mi (100 km) northeast of Bermuda.[12]
October 14
- 06:00 UTC (2:00 a.m. AST) at 34°54′N 60°30′W / 34.9°N 60.5°W / 34.9; -60.5 (Hurricane Nicole weakens to a Category 1 hurricane) – Hurricane Nicole weakens to a Category 1 hurricane about 300 mi (485 km) northeast of Bermuda.[12]
October 18
- 00:00 UTC (8:00 p.m. AST, October 17) at 43°30′N 41°54′W / 43.5°N 41.9°W / 43.5; -41.9 (Hurricane Nicole weakens to a tropical storm) – Hurricane Nicole weakens to a tropical storm about 620 mi (1,000 km) west-northwest of the Azores.[12]
- 12:00 UTC (8:00 a.m. AST) at 49°00′N 38°30′W / 49.0°N 38.5°W / 49.0; -38.5 (Tropical Storm Nicole transitions into an extratropical cyclone) – Tropical Storm Nicole transitions into an extratropical cyclone about 755 mi (1,215 km) northwest of the Azores.[12]
November

November 20
- 18:00 UTC (1:00 p.m. EST) at 11°06′N 79°42′W / 11.1°N 79.7°W / 11.1; -79.7 (Tropical Depression Sixteen develops from an area of low pressure) – Tropical Depression Sixteen develops from an area of low pressure about 120 mi (195 km) north of Colón, Panama.[1]
November 21
- 06:00 UTC (1:00 a.m. EST) at 11°18′N 79°18′W / 11.3°N 79.3°W / 11.3; -79.3 (Tropical Depression Sixteen intensifies into Tropical Storm Otto) – Tropical Depression Sixteen intensifies into Tropical Storm Otto roughly 145 mi (235 km) north-northeast of Colón, Panama.[1]
November 23
- 18:00 UTC (1:00 p.m. EST) at 11°12′N 81°06′W / 11.2°N 81.1°W / 11.2; -81.1 (Tropical Storm Otto intensifies into a Category 1 hurricane) – Tropical Storm Otto intensifies into a Category 1 hurricane approximately 155 mi (250 km) northwest of Colón, Panama.[1]
November 24
- 06:00 UTC (1:00 a.m. EST) at 11°06′N 82°24′W / 11.1°N 82.4°W / 11.1; -82.4 (Hurricane Otto intensifies into a Category 2 hurricane) – Hurricane Otto intensifies into a Category 2 hurricane about 90 mi (150 km) east of the Costa Rica–Nicaragua border.[1]
- 12:00 UTC (7:00 a.m. EST) at 11°00′N 83°00′W / 11.0°N 83.0°W / 11.0; -83.0 (Hurricane Otto intensifies into a Category 3 hurricane and attains its peak intensity)& – Hurricane Otto intensifies into a Category 3 hurricane and simultaneously attains its peak intensity with maximum sustained winds of 115 mph (185 km/h) and a minimum barometric pressure of 975 mb (hPa; 28.80 inHg) roughly 45 mi (75 km) east of the Costa Rica–Nicaragua border.[1]
- 17:30 UTC (12:30 p.m. EST) at 11°00′N 83°48′W / 11.0°N 83.8°W / 11.0; -83.8 (Hurricane Otto makes landfall) – Hurricane Otto makes landfall approximately 10 mi (15 km) northwest of the Costa Rica–Nicaragua border, with winds of 115 mph (185 km/h).[1]
- 18:00 UTC (1:00 p.m. EST) at 11°00′N 83°54′W / 11.0°N 83.9°W / 11.0; -83.9 (Hurricane Otto weakens to a Category 2 hurricane) – Hurricane Otto weakens to a Category 2 hurricane about 15 mi (25 km) northwest of the Costa Rica–Nicaragua border.[1]
November 25
- 00:00 UTC (7:00 p.m. EST, November 24) at 10°54′N 84°54′W / 10.9°N 84.9°W / 10.9; -84.9 (Hurricane Otto weakens to a Category 1 hurricane) – Hurricane Otto weakens to a Category 1 hurricane roughly 40 mi (65 km) northeast of Liberia, Costa Rica.[1]
- 03:30 UTC (9:30 p.m. CST, November 24) at 10°42′N 85°36′W / 10.7°N 85.6°W / 10.7; -85.6 (Hurricane Otto weakens to a tropical storm and exits the Atlantic Basin) – Hurricane Otto weakens to a tropical storm over northwestern Costa Rica near the Gulf of Papagayo, just before crossing the Pacific coast and exiting the Atlantic basin.[nb 4][1]
November 30
- The 2016 Atlantic hurricane season officially ends.[5]
See also
 Tropical cyclones portal

- Lists of Atlantic hurricanes
- Timeline of the 2016 Pacific hurricane season
- Timeline of the 2016 Pacific typhoon season
Notes
- ^ The last storm, Otto, did not dissipate on November 25. It crossed into the Eastern Pacific, and because it was the final storm of the season, the crossover date is listed on here as the dissipation date.[1]
- ^ An average Atlantic hurricane season, as defined by the National Oceanic and Atmospheric Administration, has 12 tropical storms, six hurricanes and two major hurricanes.[2]
- ^ Hurricanes reaching Category 3 and higher on the Saffir–Simpson scale are considered major hurricanes.[6]
- ^ Otto weakened to a tropical depression by 12:00 UTC (7:00 a.m. CST) on November 26, and degenerated into a trough of low pressure soon thereafter about 490 mi (785 km) south of Salina Cruz, Oaxaca.[1]
References
- ^ a b c d e f g h i j k l Daniel P. Brown (January 30, 2017). Tropical Cyclone Report: Hurricane Otto (PDF) (Report). Miami, Florida: National Hurricane Center. pp. 1, 2, 8, 9. Archived (PDF) from the original on April 28, 2017. Retrieved February 3, 2017.
- ^ "Background Information: North Atlantic Hurricane Season". College Park, Maryland: NOAA Climate Prediction Center. Retrieved July 11, 2020.
- ^ First above-normal Atlantic hurricane season since 2012 produced five landfalling U.S. storms (Report). National Oceanic and Atmospheric Administration. November 30, 2016. Archived from the original on April 28, 2017. Retrieved May 7, 2017.
- ^ Hurricane Season 2016 (Report). Cayman Islands National Weather Service. Retrieved May 7, 2017.
- ^ a b c Dorst, Neal (June 1, 2018). "Hurricane Season Information". Frequently Asked Questions About Hurricanes. Miami, Florida: NOAA Atlantic Oceanographic and Meteorological Laboratory. Retrieved June 29, 2020.
- ^ "Saffir-Simpson Hurricane Wind Scale". nhc.noaa.gov. Miami Florida: NOAA National Hurricane Center. Retrieved July 14, 2020.
- ^ Bob Henson (January 15, 2016). "Astounding Alex Hits the Azores: January's First Atlantic Landfall in 61 Years". Weather Underground. Archived from the original on January 21, 2016. Retrieved January 22, 2016.
- ^ Dr. Jeff Masters (June 5, 2016). "Tropical Storm Colin Becomes Earliest "C" Storm in Atlantic History". Weather Underground. Archived from the original on November 26, 2016. Retrieved September 18, 2016.
- ^ Dr. Jeff Masters; Bob Henson (June 20, 2016). "Danielle the Atlantic's Earliest 4th Storm on Record; 115°-120° Heat in SW U.S." Weather Underground. Archived from the original on November 9, 2016. Retrieved September 18, 2016.
- ^ Jon Erdman (September 2, 2016). "Hurricane Hermine Ends Florida's Record-Smashing Hurricane Drought". The Weather Channel. Archived from the original on September 17, 2016. Retrieved September 18, 2016.
- ^ a b c d e f g h i j k l m n o p q r s Stacy R. Stewart (April 7, 2017). Tropical Cyclone Report: Hurricane Matthew (PDF) (Report). Miami, Florida: National Hurricane Center. pp. 2–5, 27–29. Archived (PDF) from the original on April 5, 2017. Retrieved April 12, 2017.
- ^ a b c d e f g h i j k l m n o p Todd B. Kimberlain; Andrew S. Latto (February 15, 2017). Tropical Cyclone Report: Hurricane Nicole (PDF) (Report). Miami, Florida: National Hurricane Center. pp. 2, 3, 8, 9. Archived (PDF) from the original on February 17, 2017. Retrieved February 16, 2017.
- ^ "Tropical Cyclone Naming History and Retired Names". miami, Florida: NOAA National Hurricane Center. Retrieved July 14, 2020.
- ^ "Understanding the Date/Time Stamps". Miami, Florida: NOAA National Hurricane Center. Retrieved July 10, 2020.
- ^ "Update on National Hurricane Center Products and Services for 2020" (PDF). Miami, Florida: National Hurricane Center. April 20, 2020. Retrieved May 17, 2020.
- ^ a b c d e f Eric S. Blake (September 13, 2016). Tropical Cyclone Report: Hurricane Alex (PDF) (Report). Miami, Florida: National Hurricane Center. pp. 1, 2, 5, 6. Archived (PDF) from the original on February 3, 2017. Retrieved February 1, 2017.
- ^ a b c d e f g h i j k Michael J. Brennan (October 14, 2016). Tropical Cyclone Report: Tropical Storm Bonnie (PDF) (Report). Miami, Florida: National Hurricane Center. pp. 1, 2, 3, 6, 7, 8. Archived (PDF) from the original on February 3, 2017. Retrieved February 4, 2017.
- ^ a b c d e Richard J. Pasch; Andrew B. Penny (January 17, 2017). Tropical Cyclone Report: Tropical Storm Colin (PDF) (Report). Miami, Florida: National Hurricane Center. pp. 2, 6. Archived (PDF) from the original on January 28, 2017. Retrieved February 4, 2017.
- ^ a b c d e f John L. Beven II (September 8, 2016). Tropical Cyclone Report: Tropical Storm Danielle (PDF) (Report). Miami, Florida: National Hurricane Center. pp. 2, 5. Archived (PDF) from the original on February 3, 2017. Retrieved February 5, 2017.
- ^ a b c d e f g h Stacy R. Stewart (January 19, 2017). Tropical Cyclone Report: Hurricane Earl (PDF) (Report). Miami, Florida: National Hurricane Center. pp. 2, 8. Archived (PDF) from the original on January 27, 2017. Retrieved February 5, 2017.
- ^ a b c d e Todd B. Kimberlain (November 11, 2016). Tropical Cyclone Report: Tropical Storm Fiona (PDF) (Report). Miami, Florida: National Hurricane Center. pp. 5, 6. Archived (PDF) from the original on February 3, 2017. Retrieved February 17, 2017.
- ^ a b c d e f g h i j k l m n Daniel P. Brown (January 11, 2017). Tropical Cyclone Report: Hurricane Gaston (PDF) (Report). Miami, Florida: National Hurricane Center. pp. 2, 3, 6, 7. Archived (PDF) from the original on April 28, 2017. Retrieved April 10, 2017.
- ^ a b John P. Cangialosi (December 6, 2016). Tropical Cyclone Report: Tropical Depression Eight (PDF) (Report). Miami, Florida: National Hurricane Center. pp. 2, 5, 6. Archived (PDF) from the original on April 28, 2017. Retrieved April 10, 2017.
- ^ a b c d e f Robbie J. Berg (January 30, 2017). Tropical Cyclone Report: Hurricane Hermine (PDF) (Report). Miami, Florida: National Hurricane Center. pp. 2, 3, 12, 13. Archived (PDF) from the original on April 27, 2017. Retrieved April 10, 2017.
- ^ a b c d e Lixion A. Avila (January 3, 2017). Tropical Cyclone Report: Tropical Storm Ian (PDF) (Report). Miami, Florida: National Hurricane Center. pp. 2, 4. Archived (PDF) from the original on April 28, 2017. Retrieved April 11, 2017.
- ^ a b c d e f Eric S. Blake (January 20, 2017). Tropical Cyclone Report: Tropical Storm Julia (PDF) (Report). Miami, Florida: National Hurricane Center. pp. 2, 3, 5, 6. Archived (PDF) from the original on April 28, 2017. Retrieved April 11, 2017.
- ^ a b c d e f g Richard J. Pasch; David A. Zelinsky (January 4, 2017). Tropical Cyclone Report: Tropical Storm Karl (PDF) (Report). Miami, Florida: National Hurricane Center. pp. 2, 5, 6, 7. Archived (PDF) from the original on April 28, 2017. Retrieved April 11, 2017.
- ^ a b c d e John L. Beven II (February 3, 2017). Tropical Cyclone Report: Tropical Storm Lisa (PDF) (Report). Miami, Florida: National Hurricane Center. pp. 2, 5, 6. Archived (PDF) from the original on April 13, 2017. Retrieved April 12, 2017.
External links
Wikimedia Commons has media related to 2016 Atlantic hurricane season.
- 2016 Tropical Cyclone Advisory Archive, National Hurricane Center and Central Pacific Hurricane Center
- Hurricanes and Tropical Storms – Annual 2016, National Centers for Environmental Information


