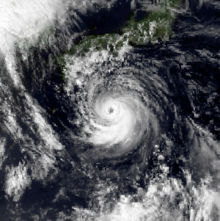
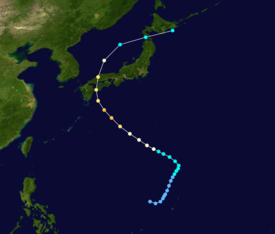
Typhoon Zola struck Japan during August 1990. An area of disturbed weather developed during mid-August to the west of Guam. The disturbance developed into a tropical depression on August 16 while tracking eastward. Decreased wind shear aided in intensification, and it is estimated that the depression strengthened into a tropical storm on August 17. Continuing to intensify, Zola turned northwest in response to a subtropical ridge to its east before obtaining typhoon intensity on August 20. Typhoon Zola reached its peak intensity the next day. After weakening slightly, the storm moved ashore on Honshu. On August 23, the system transitioned into an extratropical cyclone over the Sea of Japan.
The typhoon dropped heavy rains across much of the Japanese archipelago. Near where the storm moved over ashore, in Kōchi Prefecture, three people were injured. Thirty-eight homes were damaged or destroyed. Further north, 7 people were injured in Hiroshima Prefecture, where 30 houses were damaged or destroyed, and 19 others were flooded. Power lines were cut in 84,000 locations and 2,100 hectares (5,200 acres) of farmland were damaged in the prefecture. Nationwide, six people were killed while twenty-four others were hurt. A total 67 houses were destroyed while 420 others were flooded. A total of 16 ships and 4,560 acres (1,850 hectares) of farmland were damaged. Over 250 flights were called off. In all, damage totaled ¥15.1 billion, equal to US$104 million.[nb 1][nb 2]
Extratropical cyclone, remnant low, tropical disturbance, or monsoon depression
Following the formation of Typhoon Yancy, there was a pronounced surge of southwesterly flow in the Western Pacific monsoon trough west of Guam. Thunderstorm activity began to persist east of Yancy, but further development was slow to occur because of strong vertical wind shear. Early on August 15, the Joint Typhoon Warning Center (JTWC) started watching a persistent area of disturbed weather west of Guam.[1] Initially, the disturbance tracked west-northwest[2] and then eastward, but further development was inhibited by strong vertical wind shear.[1] At 00:00 UTC on August 16, the Japan Meteorological Agency (JMA) upgraded the disturbance into a tropical depression. Banding quickly wrapped around the center around a low-level circulation[3][nb 3] as the disturbance passed through the Mariana Islands.[2] By the evening of August 16, the JTWC issued a Tropical Cyclone Formation Alert, and the following morning, upgraded the system into a tropical depression.[1][nb 4] The depression turned west-northwest in response to a shortwave trough that tracked north of the system.[1] At noon on August 17, the JMA upgraded it to a tropical storm,[3] although the JTWC did not follow suit until early on August 18,[6] when ship reports indicated a tighter pressure gradient and winds of 105 km/h (65 mph).[1]
Tropical Storm Zola continued northwest and tracked through region of divergence aloft, which aided intensification.[1] At 06:00 UTC on August 18, the JMA upgraded Zola into a severe tropical storm.[7] Further intensification was initially halted because the storm remained embedded in the monsoon trough, but on August 19, Zola began to detach from the monsoonal trough, coinciding with an expansion of the storm's equatorial outflow channel. The cyclone subsequently resumed intensification while turning northwest in response to a subtropical ridge between China and Japan. Following the appearance of a ragged 45 km (30 mi) eye on weather satellite imagery and a Dvorak classification of T4.0/120 km/h (75 mph),[1] Zola was classified as a typhoon at 00:00 UTC on August 20 by the JTWC.[6] The JMA followed suit later that same morning.[3]
Further intensification was aided by a tropical upper tropospheric trough that provided an excellent poleward outflow channel. Based an increase in the storm's organization, the JTWC raised the intensity of the storm to 185 km/h (115 mph) at 06:00 UTC on August 21, its peak intensity.[1] Around this time, the JMA estimated that Zola peaked in intensity, with winds of 135 km/h (85 mph) and a minimum barometric pressure of 975 mbar (28.8 inHg).[7] Increased southwesterly wind shear took toll on the typhoon,[1] and the storm weakened slightly prior as it passed between Kyushu and Shikoku,[2] with the JTWC and JMA reporting winds of 175 and 130 km/h (110 and 80 mph) respectively at the time of landfall[7] on western Honshu.[2] After recurving to the northeast over the Sea of Japan,[1] Zola weakened to a tropical storm on August 22[7] and transitioned into a mid-latitude cyclone while interacting with the westerlies early on August 23.[1] Both agencies ceased tracking the system at this time.[7]
Impact
The typhoon dropped heavy rainfall across much of the Japanese archipelago.[8] A peak rainfall total occurred of 597 mm (23.5 in) at Yanase Station.[9] A peak hourly rainfall total of 74 mm (2.9 in) was observed in Miyagawa.[10] Meanwhile, a peak daily precipitation total of 543 mm (21.4 in) fell in Motoyama.[11] A wind gust of 44 km/h (27 mph) was recorded on Muroto.[12]
Near where the storm moved over Shikoku island, in Kōchi Prefecture, three people suffered injuries. Three homes were destroyed, with an additional thirty-five harmed. Roads were damaged in 368 locations. Throughout the prefecture, damage totaled ¥5.29 billion (US$36.7 million).[13] Roads were harmed in one hundred twenty-seven locations while bridges sustained damage in four locations in Tokushima Prefecture.[14] Across Kagawa Prefecture, ferry service to surrounding islands were suspended, and 19 trains were cancelled, but impact in the prefecture was slight.[15] Thirteen people were wounded and 155 homes were damaged in Ehime Prefecture. Damage was placed at ¥5.44 billion (US$37.5 million).[16] Elsewhere, two ships were harmed and one causality occurred in Miyazaki Prefecture.[17] In Ōita Prefecture, several people were injured in traffic accidents and damage totaled ¥330 million (US$2.28 million).[18] High waves and tides caused damaging storm surge in Hyōgo Prefecture, where 16 dwellings sustained damaged and total damage amounted to ¥665.15 million (US$4.59 million).[19] One person perished in Okayama Prefecture. At the Okayama Airport, three flights were cancelled and two others were delayed for over half an hour.[20]Storm surge and torrential rains resulted in heavy damage to Hiroshima prefecture. Seven people were injured, including two seriously. Two homes were destroyed and 177 others were damaged. A total of 98 roads in the prefecture were washed away and power lines were cut in 84,000 locations. Additionally, 2,100 ha (5,190 acres) of farmland was damaged, totaling ¥1.44 billion (US$9.93 million). Damage across Hiroshima prefecture was assessed at ¥2.70 billion (US$18.6 million).[21] In Kyoto Prefecture, 79 structures were damaged.[22] Agriculture damage in Tottori Prefecture totaled ¥406 million (US$2.81 million).[23] One person was killed in Shimane Prefecture and damage amounted to ¥69 million (US$476,000). The main roads in the cities of Sada and Izumo were deemed impassable during the height of the storm. A total of 15 flights were cancelled from the Oki Airport and Izumo Airport. Furthermore, 15 ferries were cancelled to and from the Oki Islands.[24] In Shizuoka Prefecture, one home was destroyed and three roofs were damaged.[25] Four train lines were suspended in the Mie Prefecture, leaving 2,200 individuals stranded.[26] In Fukui Prefecture, one person was hurt and agricultural damage amounted to ¥18 million (US$124,000).[27] Across Hokkaido prefecture, the northernmost prefecture in the country, one house and ten roads were flooded. Damage there totaled ¥76.5 million (US$528,000).[28]
Overall, six fatalities were reported and twenty-four others sustained injuries.[8] The typhoon, in conjunction with Tropical Storm Winona, assisted an ongoing drought.[29] A total 67 houses were destroyed while 420 others were flooded.[8] Sixteen ships and 4,560 acres (1,845 ha) of farmland were damaged.[8] More than 250 flights were cancelled due to adverse weather.[2] Monetary damage totaled ¥15.1 billion (US$104 million).[8] Zola was the second of six tropical cyclone to directly affect Japan in 1990, which set a record for the most systems to hit the country in a year; it was also the latest typhoon to hit the country, with the previous mark set by Typhoon Agnes of the 1948 Pacific typhoon season.[30]
See also
Tropical cyclones portal
Typhoon Caitlin (1991)
Notes
^All currencies are converted from Japanese yen to United States Dollars using this with an exchange rate of the year 1990.
^All damage totals are in 1990 values of their respective currencies.
^Wind estimates from the JMA and most other basins throughout the world are sustained over 10 minutes, while estimates from the United States-based Joint Typhoon Warning Center are sustained over 1 minute. 10-minute winds are about 1.14 times the amount of 1-minute winds.[5]
References
^ abcdefghijkJoint Typhoon Warning Center; Naval Pacific Meteorology and Oceanography Center (1992). Annual Tropical Cyclone Report: 1990 (PDF) (Report). United States Navy, United States Air Force. pp. 111–112. Retrieved June 20, 2017.
^ abcdeHong Kong Observatory (1991). "Part III – Tropical Cyclone Summaries". Meteorological Results: 1990 (PDF). Meteorological Results (Report). Hong Kong Observatory. p. 16. Retrieved June 26, 2017.
^ abcJapan Meteorological Agency (October 10, 1992). RSMC Best Track Data – 1990–1999 (.TXT) (Report). Retrieved June 26, 2017.
^"Annual Report on Activities of the RSMC Tokyo – Typhoon Center 2000" (PDF). Japan Meteorological Agency. February 2001. p. 3. Retrieved June 26, 2017.
^Christopher W Landsea; Hurricane Research Division (April 26, 2004). "Subject: D4) What does "maximum sustained wind" mean? How does it relate to gusts in tropical cyclones?". Frequently Asked Questions. National Oceanic and Atmospheric Administration's Atlantic Oceanographic and Meteorological Laboratory. Retrieved June 26, 2017.
^ abTyphoon 14W Best Track (TXT) (Report). Joint Typhoon Warning Center. December 17, 2002. Retrieved June 26, 2017.
^ abcdeKenneth R. Knapp; Michael C. Kruk; David H. Levinson; Howard J. Diamond; Charles J. Neumann (2010). 1990 ZOLA (1990228N15141). The International Best Track Archive for Climate Stewardship (IBTrACS): Unifying tropical cyclone best track data (Report). Bulletin of the American Meteorological Society. Retrieved June 26, 2017.
^ abcdeAsanobu, Kitamoto. Typhoon 199014 (Zola). Digital Typhoon (Report). National Institute of Informatics. Retrieved June 30, 2017.
^Asanobu, Kitamoto. AMeDAS YANASE (74151) @ Typhoon 199014. Digital Typhoon (Report). National Institute of Informatics. Retrieved June 30, 2017.
^Asanobu, Kitamoto. AMeDAS MOTOYAMA (74071) @ Typhoon 199014. Digital Typhoon (Report). National Institute of Informatics. Retrieved June 30, 2017.
^Asanobu, Kitamoto. AMeDAS MOTOYAMA (74071) @ Typhoon 199014. Digital Typhoon (Report). National Institute of Informatics. Retrieved June 30, 2017.
^Asanobu, Kitamoto. AMeDAS MUROTOMISAKI (74371) @ Typhoon 199014. Digital Typhoon (Report). National Institute of Informatics. Retrieved June 30, 2017.
^Asanobu, Kitamoto. 1990-893-08. Digital Typhoon (Report) (in Japanese). National Institute of Informatics. Retrieved June 30, 2017.
^Asanobu, Kitamoto. 1990-895-10. Digital Typhoon (Report) (in Japanese). National Institute of Informatics. Retrieved June 30, 2017.
^Asanobu, Kitamoto. 1990-891-09. Digital Typhoon (Report) (in Japanese). National Institute of Informatics. Retrieved June 30, 2017.
^Asanobu, Kitamoto. 1990-887-11. Digital Typhoon (Report) (in Japanese). National Institute of Informatics. Retrieved June 30, 2017.
^Asanobu, Kitamoto. 1990-830-04. Digital Typhoon (Report) (in Japanese). National Institute of Informatics. Retrieved June 30, 2017.
^Asanobu, Kitamoto. 1990-815-08. Digital Typhoon (Report) (in Japanese). National Institute of Informatics. Retrieved June 30, 2017.
^Asanobu, Kitamoto. 1990-777-05. Digital Typhoon (Report) (in Japanese). National Institute of Informatics. Retrieved June 30, 2017.
^Asanobu, Kitamoto. 1990-768-10. Digital Typhoon (Report) (in Japanese). National Institute of Informatics. Retrieved June 30, 2017.
^Asanobu, Kitamoto. 1990-765-10. Digital Typhoon (Report) (in Japanese). National Institute of Informatics. Retrieved June 30, 2017.
^Asanobu, Kitamoto. 1990-759-13. Digital Typhoon (Report) (in Japanese). National Institute of Informatics. Retrieved June 30, 2017.
^Asanobu, Kitamoto. 1990-746-05. Digital Typhoon (Report) (in Japanese). National Institute of Informatics. Retrieved June 30, 2017.
^Asanobu, Kitamoto. 1990-741-02. Digital Typhoon (Report) (in Japanese). National Institute of Informatics. Retrieved June 30, 2017.
^Asanobu, Kitamoto. 1990-656-15. Digital Typhoon (Report) (in Japanese). National Institute of Informatics. Retrieved June 30, 2017.
^Asanobu, Kitamoto. 1990-651-07. Digital Typhoon (Report) (in Japanese). National Institute of Informatics. Retrieved June 30, 2017.
^Asanobu, Kitamoto. 1990-616-07. Digital Typhoon (Report) (in Japanese). National Institute of Informatics. Retrieved June 30, 2017.
^Asanobu, Kitamoto. 1990-428-04. Digital Typhoon (Report) (in Japanese). National Institute of Informatics. Retrieved June 30, 2017.
^Asanobu, Kitamoto. 1990-891-07. Digital Typhoon (Report) (in Japanese). National Institute of Informatics. Retrieved June 30, 2017.
^"Unseasonal Typhoon Slows Rail, Air Traffic". Associated Press. November 30, 1990. – via Lexis Nexis (subscription required)
 Tropical cyclone
 Subtropical cyclone
 Extratropical cyclone, remnant low, tropical disturbance, or monsoon depression


