Part of the 1991 Irish local elections
1991 Carlow County Council election
|
|
All 21 seats on Carlow County Council |
|---|
| | First party | Second party | Third party | | | | | | | Party | Fianna Fáil | Fine Gael | Labour | | Seats won | 9 | 7 | 4 | | Seat change | -1 | - | +1 |
| | | Fourth party | Fifth party | | | | | | Party | Progressive Democrats | Independent | | Seats won | 1 | 0 | | Seat change | +1 | -1 | |
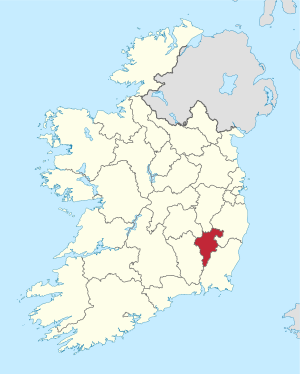 Map showing the area of Carlow County Council |
Council control before election
Fine Gael/Labour
| Council control after election
Fine Gael/Labour
| |
An election to Carlow County Council took place on 27 June 1991 as part of that year's Irish local elections. 21 councillors were elected from four local electoral areas (LEAs) for a five-year term of office on the electoral system of proportional representation by means of the single transferable vote (PR-STV). This term was extended twice, first to 1998, then to 1999.[1][2]
Results by party
| Party | Seats | ± | First Pref. votes | FPv% | ±% |
| | Fianna Fáil | 9 | -1 | 6,767 | 39.4 | |
| | Fine Gael | 7 | - | 5,312 | 30.9 | |
| | Labour | 4 | +1 | 4,002 | 23.3 | |
| | Progressive Democrats | 1 | +1 | 436 | 2.54 | |
| | Independent | 0 | -1 | 670 | 3.9 | |
| Totals | 21 | - | 17,187 | 100.0 | — |
Results by local electoral area
Borris
Borris - 4 seats | Party | Candidate | FPv% | Count |
| 1 | 2 | 3 | 4 |
| | Labour | Michael Meaney* | 29.2% | 1,020 | | | |
| | Fianna Fáil | Mary Kinsella* | 16.4% | 575 | 636 | 741 | |
| | Fianna Fáil | Brendan Walsh | 15.5% | 543 | 603 | 655 | 667 |
| | Fine Gael | Michael Doyle* | 14.2% | 498 | 577 | 596 | 808 |
| | Fianna Fáil | Liam Murphy* | 9.1% | 317 | 361 | 446 | 493 |
| | Fine Gael | Ciaran Redmond | 7.9% | 278 | 313 | 331 | |
| | Fianna Fáil | David Moore | 7.6% | 267 | 308 | | |
| Electorate: 5,866 Valid: 3,498 (59.63%) Spoilt: 36 Quota: 700 Turnout: 3,534 (60.25%) |
Carlow
Carlow - 7 seats | Party | Candidate | FPv% | Count |
| 1 | 2 | 3 | 4 | 5 | 6 | 7 | 8 | 9 | 10 | 11 |
| | Fine Gael | John Browne TD* | 14.5% | 756 | | | | | | | | | | |
| | Fianna Fáil | Patrick Carpenter* | 10.7% | 560 | 575 | 588 | 648 | 673 | | | | | | |
| | Labour | Des Hurley | 10.7% | 557 | 558 | 563 | 592 | 707 | | | | | | |
| | Fianna Fáil | Jimmy Murnane* | 10.4% | 545 | 551 | 554 | 566 | 576 | 580 | 582 | 614 | 635 | 649 | 664 |
| | Progressive Democrats | Walter Lacey | 8.3% | 436 | 439 | 451 | 475 | 499 | 513 | 516 | 542 | 595 | 696 | |
| | Fine Gael | Declan Alcock | 7.9% | 413 | 414 | 428 | 440 | 450 | 460 | 462 | 486 | 570 | 739 | |
| | Fianna Fáil | M.J. Nolan TD* | 7.3% | 379 | 389 | 395 | 406 | 413 | 414 | 416 | 489 | 524 | 563 | 578 |
| | Fianna Fáil | Rody Kelly | 6% | 314 | 325 | 332 | 344 | 362 | 363 | 364 | 428 | 444 | 474 | 495 |
| | Fine Gael | Patrick Governey* | 4.9% | 255 | 257 | 278 | 289 | 299 | 306 | 308 | 322 | | | |
| | Fine Gael | Sean Whelan | 4.8% | 253 | 261 | 275 | 275 | 289 | 301 | 308 | 336 | 407 | | |
| | Fianna Fáil | Joe McDonald | 4.7% | 243 | 253 | 256 | 263 | 277 | 282 | 282 | | | | |
| | Labour | Cecil Whelan | 4.6% | 238 | 242 | 245 | 257 | | | | | | | |
| | Independent | James Brady | 3.8% | 201 | 202 | 204 | | | | | | | | |
| | Independent | Sean Prendergast | 1.4% | 73 | | | | | | | | | | |
| Electorate: 10,567 Valid: 5,223 (49.43%) Spoilt: 43 Quota: 653 Turnout: 5,265 (49.82%) |
Muinebheag
Muinebheag - 5 seats | Party | Candidate | FPv% | Count |
| 1 | 2 | 3 | 4 | 5 | 6 | 7 | 8 | 9 |
| | Labour | John McNally* | 21.7% | 980 | | | | | | | | |
| | Labour | Jim Townsend* | 18.1% | 818 | | | | | | | | |
| | Fianna Fáil | Arthur McDonald | 11% | 496 | 568 | 581 | 589 | 614 | 631 | 713 | 851 | |
| | Fianna Fáil | Enda Nolan | 9.5% | 427 | 444 | 451 | 462 | 478 | 526 | 559 | 593 | 648 |
| | Fine Gael | Mary McDonald* | 8.7% | 392 | 409 | 413 | 422 | 509 | 651 | 695 | 795 | |
| | Fianna Fáil | Martin Nevin* | 6.8% | 305 | 332 | 337 | 344 | 361 | 371 | 475 | 527 | 571 |
| | Fianna Fáil | Eddie Cullen | 6.5% | 292 | 306 | 312 | 314 | 321 | 330 | | | |
| | Independent | Denis Foley | 5.9% | 264 | 298 | 329 | 336 | 376 | 409 | 437 | | |
| | Fine Gael | Ann Brennan | 5.5% | 246 | 250 | 252 | 273 | 311 | | | | |
| | Fine Gael | Stephen Maher | 5% | 224 | 246 | 249 | 250 | | | | | |
| | Independent | John Curran | 1.2% | 56 | 74 | | | | | | | |
| | Independent | William Dillon | 0.2% | 9 | 12 | | | | | | | |
| Electorate: 7,033 Valid: 4,509 (64.11%) Spoilt: 42 Quota: 752 Turnout: 4,551 (64.71%) |
Tullow
Tullow - 5 seats | Party | Candidate | FPv% | Count |
| 1 | 2 | 3 | 4 | 5 | 6 | 7 |
| | Fine Gael | Michael Deering* | 17.3% | 683 | 627 | 639 | 649 | 690 | 860 | |
| | Fianna Fáil | John Pender* | 16.6% | 656 | 658 | 687 | | | | |
| | Fine Gael | Pat O'Toole | 13.8% | 548 | 551 | 552 | 553 | 558 | 680 | |
| | Fine Gael | Fred Hunter | 11.3% | 449 | 459 | 472 | 472 | 478 | 569 | 617 |
| | Labour | Michael Hickey | 9.8% | 389 | 407 | 430 | 432 | 435 | 482 | 537 |
| | Fianna Fáil | Arthur Kennedy* | 9% | 358 | 370 | 417 | 430 | 432 | 452 | 585 |
| | Fine Gael | Brendan Brophy* | 8% | 317 | 323 | 327 | 330 | 335 | | |
| | Fianna Fáil | Paddy Condon | 6.4% | 252 | 285 | 340 | 344 | 346 | 368 | |
| | Fianna Fáil | Mary Ann Dunne | 4.2% | 165 | 186 | | | | | |
| | Independent | Bill Leonard | 3.5% | 140 | | | | | | |
| Electorate: 6,338 Valid: 3,957 (62.43%) Spoilt: 58 Quota: 660 Turnout: 4,015 (63.35%) |
References
- ^ Local Government Act 1994, s. 20: Year of elections to all local authorities (No. 8 of 1994, s. 20). Enacted on 29 April 1994. Act of the Oireachtas. Retrieved from Irish Statute Book.
- ^ Local Government Act 1998, s. 10: Amendment of section 20 of Act of 1994 (No. 16 of 1998, s. 10). Enacted on 29 May 1998. Act of the Oireachtas. Retrieved from Irish Statute Book.
External links
- Official website[permanent dead link]
- irishelectionliterature


