Part of the 1991 Irish local elections
1991 South Dublin County Council election
|
|
26 seats on the council of the electoral county of South Dublin within Dublin County Council |
|---|
| | First party | Second party | Third party | | | | | | | Party | Fianna Fáil | Fine Gael | Labour | | Seats won | 7 | 6 | 4 | | Seat change | -6 | -2 | +2 |
| | | Fourth party | Fifth party | Sixth party | | | | | | | Party | Progressive Democrats | Workers' Party | Green | | Seats won | 4 | 3 | 1 | | Seat change | +4 | +1 | +1 |
| | | Seventh party | | | | | | | Party | Independent | | | Seats won | 1 | | | Seat change | 0 | | |
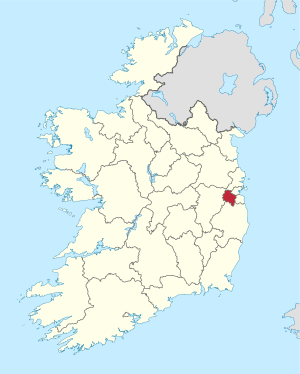 Map showing the area of South Dublin County Council |
| | Council control after election
TBD
| |
An election to the council of the electoral county of South Dublin within Dublin County to Dublin County Council took place on 27 June 1991 as part of that year's Irish local elections. 26 councillors were elected for a five-year term of office from five local electoral areas on the system of proportional representation by means of the single transferable vote.[1] It was one of three electoral counties within Dublin County at this election, the others being Fingal and Dún Laoghaire–Rathdown. The term was extended twice, first to 1998, then to 1999.[2][3]
The electoral county had been established in 1985 as Dublin–Belgard and was renamed South Dublin for these local elections.[4]
From 1 January 1994, on the coming into effect of the Local Government (Dublin) Act 1993, County Dublin was disestablished as an administrative county, and in its place the electoral counties became three new counties. The councillors listed below became the councillors for South Dublin County Council from that date.[5]
Results by party
| Party | Seats | ± | First Pref. votes | FPv% | ±% |
| | Fianna Fáil | 7 | -6 | 16,179 | 29.1 | |
| | Fine Gael | 6 | -2 | 10,176 | 18.3 | |
| | Labour | 4 | +2 | 9,796 | 17.6 | |
| | Progressive Democrats | 4 | +4 | 5,080 | 9.1 | |
| | Workers' Party | 3 | +1 | 4,842 | 8.7 | |
| | Green | 1 | +1 | 3,294 | 5.9 | |
| | Independent | 1 | 0 | 4,294 | 7.7 | |
| Totals | 26 | 0 | 53,634 | 100.0 | — |
Results by local electoral area
Clondalkin
Clondalkin - 3 seats | Party | Candidate | FPv% | Count |
| 1 | 2 | 3 | 4 | 5 | 6 | 7 |
| | Fine Gael | Therese Ridge* | 18.3% | 1,378 | 1,431 | 1,459 | 1,497 | 1,563 | 1,733 | 1,883 |
| | Progressive Democrats | Colm Tyndall | 17.7% | 1,332 | 1,355 | 1,375 | 1,447 | 1,544 | 1,647 | 1,863 |
| | Fianna Fáil | Colm McGrath* | 14.6% | 1,104 | 1,112 | 1,136 | 1,257 | 1,280 | 1,316 | 2,027 |
| | Fianna Fáil | Catherine Sherwin | 13.1% | 986 | 1,004 | 1,028 | 1,182 | 1,229 | 1,259 | |
| | Workers' Party | Donna Conlon | 8.9% | 671 | 729 | 809 | 813 | 943 | 1,292 | 1,356 |
| | Labour | Robert Dowds | 8.3% | 626 | 679 | 711 | 721 | 794 | | |
| | Fianna Fáil | Pat Smyth | 5.7% | 431 | 436 | 441 | | | | |
| | Green | Conor Delaney | 5.3% | 400 | 436 | 496 | 518 | | | |
| | Sinn Féin | Vincent Coffey | 4.2% | 315 | 340 | | | | | |
| | Independent | Maurice Duffy | 2.4% | 178 | | | | | | |
| | Independent | Maire O'Connor | 1.6% | 123 | | | | | | |
| Electorate: 20,425 Valid: 7,544 (36.9%) Spoilt: 63 Quota: 1,887 Turnout: 7,607 (37.2%) |
Greenhills
Greenhills - 4 seats | Party | Candidate | FPv% | Count |
| 1 | 2 | 3 | 4 | 5 | 6 | 7 | 8 | 9 |
| | Labour | Mervyn Taylor TD* | 24.1% | 1,576 | | | | | | | | |
| | Workers' Party | Don Tipping* | 13.9% | 912 | 966 | 995 | 1,020 | 1,107 | 1,138 | 1,306 | 1,357 | |
| | Fine Gael | Michael Keating | 11% | 720 | 745 | 754 | 875 | 919 | 946 | 1,066 | 1,126 | 1,170 |
| | Independent | Bob Byrne | 9.3% | 611 | 628 | 645 | 651 | 713 | 736 | | | |
| | Fianna Fáil | Geraldine O'Connor | 8.8% | 577 | 584 | 586 | 607 | 626 | 767 | 819 | | |
| | Fianna Fáil | Margaret Farrell | 8.1% | 525 | 537 | 549 | 555 | 580 | 828 | 943 | 1,412 | |
| | Labour | Denis Mackin | 8% | 522 | 634 | 648 | 667 | 737 | 755 | 881 | 1,040 | 1,089 |
| | Fianna Fáil | Michael Hanrahan | 7.2% | 468 | 479 | 505 | 511 | 523 | | | | |
| | Green | Alison Larkin | 4.6% | 298 | 308 | 345 | 363 | | | | | |
| | Fine Gael | Michael O'Brien | 3.4% | 224 | 228 | 228 | | | | | | |
| | Sinn Féin | Dessie Early | 2.4% | 157 | 162 | | | | | | | |
| Electorate: 16,819 Valid: 6,540 (38.9%) Spoilt: 50 Quota: 1,319 Turnout: 6,590 (39.2%) |
Lucan
Lucan - 4 seats | Party | Candidate | FPv% | Count |
| 1 | 2 | 3 | 4 | 5 | 6 | 7 | 8 | 9 | 10 | 11 |
| | Independent | Guss O'Connell | 14.2% | 1,406 | 1,477 | 1,532 | 1,649 | 1,894 | 2,032 | | | | | |
| | Fine Gael | Peter Brady | 13.5% | 1,336 | 1,346 | 1,472 | 1,549 | 1,587 | 1,612 | 1,619 | 1,775 | 1,812 | 1,987 | |
| | Fianna Fáil | Finbarr Hanrahan* | 11.3% | 1,119 | 1,126 | 1,145 | 1,182 | 1,215 | 1,440 | 1,459 | 1,514 | 1,607 | 2,362 | |
| | Fianna Fáil | Liam Lawlor TD* | 9.1% | 905 | 910 | 919 | 934 | 950 | 1,110 | 1,123 | 1,173 | 1,246 | | |
| | Labour | Eamon Tuffy | 8.3% | 826 | 829 | 834 | 927 | 1,000 | 1,026 | 1,030 | 1,211 | 1,263 | 1,315 | 1,430 |
| | Sinn Féin | John McCann | 7.9% | 783 | 789 | 797 | 808 | 815 | 828 | 830 | 919 | | | |
| | Labour | John O'Halloran | 7.8% | 775 | 781 | 795 | 815 | 884 | 898 | 901 | 1,058 | 1,379 | 1,467 | 1,553 |
| | Workers' Party | Anne Finnegan | 6.7% | 665 | 671 | 677 | 748 | 777 | 799 | 803 | | | | |
| | Fianna Fáil | Deirdre Doherty-Ryan | 5.9% | 580 | 591 | 609 | 630 | 675 | | | | | | |
| | Labour | Michael Brennan | 5% | 497 | 534 | 563 | 598 | | | | | | | |
| | Green | Bridin O'Connor | 5% | 492 | 512 | 531 | | | | | | | | |
| | Fine Gael | Tom Kavanagh | 3.1% | 311 | 316 | | | | | | | | | |
| | Independent | Michael Kirwan | 2% | 200 | | | | | | | | | | |
| Electorate: 20,266 Valid: 9,895 (48.8%) Spoilt: 75 Quota: 1,980 Turnout: 9,970 (49.2%) |
Rathfarnam
Rathfarnam - 4 seats | Party | Candidate | FPv% | Count |
| 1 | 2 | 3 | 4 | 5 | 6 | 7 |
| | Fianna Fáil | Ann Ormonde* | 19% | 1,582 | 1,584 | 1,601 | 1,872 | | | |
| | Fine Gael | Alan Shatter TD* | 14.3% | 1,191 | 1,202 | 1,241 | 1,286 | 1,303 | 1,538 | 1,671 |
| | Green | Máire Mullarney | 14% | 1,163 | 1,176 | 1,289 | 1,313 | 1,327 | 1,511 | 1,877 |
| | Fine Gael | Mary Muldoon* | 13.96% | 1,161 | 1,166 | 1,194 | 1,206 | 1,213 | 1,355 | 1,622 |
| | Fianna Fáil | Damien Fee | 10.4% | 862 | 884 | 897 | 989 | 1,142 | 1,223 | 1,325 |
| | Independent | Vincent Kenny | 9.1% | 760 | 767 | 832 | 842 | 849 | 944 | |
| | Progressive Democrats | Ronnie McBrien | 8.6% | 719 | 721 | 760 | 778 | 788 | | |
| | Fianna Fáil | Stephen Riney* | 5.8% | 479 | 479 | 485 | | | | |
| | Labour | Billy Byrne | 2.7% | 227 | 339 | | | | | |
| | Labour | Graham Corcoran | 1.9% | 154 | | | | | | |
| Electorate: 20,175 Valid: 8,318 (41.2%) Spoilt: 35 Quota: 1,664 Turnout: 8,353 (41.4%) |
Tallaght-Oldbawn
Tallaght-Oldbawn - 3 seats | Party | Candidate | FPv% | Count |
| 1 | 2 | 3 | 4 | 5 | 6 | 7 | 8 | 9 | 10 |
| | Fianna Fáil | John Hannon* | 22.3% | 1,572 | 1,579 | 1,590 | 1,663 | 1,684 | 1,915 | | | | |
| | Workers' Party | Pat Rabbitte TD* | 13.5% | 947 | 967 | 980 | 994 | 1,066 | 1,102 | 1,125 | 1,255 | 1,472 | 1,736 |
| | Progressive Democrats | Breda Cass* | 12.7% | 892 | 900 | 916 | 920 | 969 | 998 | 1,021 | 1,062 | 1,131 | 1,501 |
| | Fine Gael | Senator Larry McMahon* | 11.2% | 789 | 799 | 889 | 912 | 942 | 964 | 988 | 1,009 | 1,083 | |
| | Labour | Eamonn Maloney | 9.5% | 667 | 677 | 689 | 703 | 741 | 748 | 756 | 801 | | |
| | Labour | Ned Gibbons | 9.4% | 663 | 667 | 673 | 676 | 706 | 762 | 775 | 885 | 1,271 | 1,415 |
| | Sinn Féin | Seán Crowe | 5.7% | 399 | 436 | 438 | 441 | 461 | 480 | 496 | | | |
| | Fianna Fáil | Jim Barry* | 5.5% | 389 | 394 | 395 | 430 | 434 | | | | | |
| | Green | Malachy Murphy | 3.7% | 259 | 271 | 279 | 280 | | | | | | |
| | Fianna Fáil | Frank Dwan | 2.5% | 178 | 179 | 179 | | | | | | | |
| | Fine Gael | Paul Ringland | 2.2% | 158 | 159 | | | | | | | | |
| | Republican Sinn Féin | Peter Cunningham | 1.8% | 125 | | | | | | | | | |
| Electorate: 14,687 Valid: 6,388 (43.5%) Spoilt: 89 Quota: 1,598 Turnout: 6,477 (44.1%) |
Tallaght-Rathcoole
Tallaght-Rathcoole- 3 seats | Party | Candidate | FPv% | Count |
| 1 | 2 | 3 | 4 | 5 | 6 | 7 | 8 | 9 |
| | Workers' Party | Mick Billane | 20.3% | 1217 | 1,228 | 1,264 | 1,306 | 1,368 | 1,488 | 1,554 | | |
| | Fianna Fáil | Charlie O'Connor | 15.4% | 922 | 987 | 996 | 1,019 | 1,144 | 1,182 | 1,216 | 1,220 | 1,656 |
| | Progressive Democrats | Catherine Quinn | 13.1% | 785 | 786 | 796 | 889 | 934 | 982 | 1,199 | 1,208 | 1,421 |
| | Fianna Fáil | Jim Daly* | 12.3% | 741 | 757 | 759 | 764 | 783 | 832 | 904 | 914 | |
| | Labour | Maria Ingle | 11.6% | 694 | 700 | 712 | 741 | 815 | 886 | 936 | 954 | 1,028 |
| | Sinn Féin | Tony Flannery | 6.4% | 386 | 390 | 397 | 409 | 429 | | | | |
| | Fine Gael | Pat Corcoran | 6.4% | 384 | 388 | 451 | 463 | 484 | 519 | | | |
| | Independent | John O'Mahony | 6% | 359 | 363 | 374 | 389 | | | | | |
| | Progressive Democrats | Martin Smith | 3.7% | 224 | 226 | 248 | | | | | | |
| | Fine Gael | Jim Lovett | 2.9% | 177 | 178 | | | | | | | |
| | Fianna Fáil | Mary Morton | 1.9% | 114 | | | | | | | | |
| Electorate: 15,744 Valid: 6,003 (38.1%) Spoilt: 80 Quota: 1,501 Turnout: 6,083 (38.6%) |
Terenure
Terenure- 5 seats | Party | Candidate | FPv% | Count |
| 1 | 2 | 3 | 4 | 5 | 6 | 7 | 8 |
| | Fine Gael | Stanley Laing* | 14.4% | 1,488 | 1,503 | 1,541 | 1,566 | 1,585 | 1,630 | 1,685 | 1,768 |
| | Labour | Éamonn Walsh | 12.4% | 1,278 | 1,382 | 1,384 | 1,527 | 1,625 | 1,656 | 1,678 | 1,845 |
| | Labour | Senator Pat Upton | 11.3% | 1,169 | 1,309 | 1,352 | 1,424 | 1,454 | 1,492 | 1,520 | 1,780 |
| | Progressive Democrats | Cáit Keane | 10.9% | 1,128 | 1,159 | 1,173 | 1,218 | 1,267 | 1,317 | 1,376 | 1,542 |
| | Fianna Fáil | Sean Ardagh* | 10.4% | 1,070 | 1,075 | 1,268 | 1,311 | 1,540 | 2,082 | | |
| | Fine Gael | Martin Lynch* | 9.5% | 981 | 992 | 1,014 | 1,037 | 1,051 | 1,081 | 1,096 | 1,163 |
| | Green | Jim Murphy | 6.6% | 682 | 751 | 761 | 851 | 880 | 904 | 940 | |
| | Fianna Fáil | Michael J. Stokes | 5.4% | 555 | 564 | 641 | 675 | 848 | | | |
| | Fianna Fáil | Molly Tighe | 5.3% | 550 | 559 | 615 | 671 | | | | |
| | Independent | Seamus Ashe* | 5.1% | 532 | 561 | 566 | | | | | |
| | Fianna Fáil | Gerry Mullally | 4.5% | 470 | 472 | | | | | | |
| | Workers' Party | Deirdre O'Connell | 4.2% | 430 | | | | | | | |
| Electorate: 24,148 Valid: 10,333 (42.8%) Spoilt: 85 Quota: 1,723 Turnout: 10,418 (43.1%) |
References
- ^ Dublin Electoral Counties Order 1985 (S.I. No. 133 of 1985). Signed on 10 May 1985. Statutory Instrument of the Government of Ireland. Retrieved from Irish Statute Book on 13 December 2021.
- ^ Local Government Act 1994, s. 20: Year of elections to all local authorities (No. 8 of 1994, s. 20). Enacted on 29 April 1994. Act of the Oireachtas. Retrieved from Irish Statute Book.
- ^ Local Government Act 1998, s. 10: Amendment of section 20 of Act of 1994 (No. 16 of 1998, s. 10). Enacted on 29 May 1998. Act of the Oireachtas. Retrieved from Irish Statute Book.
- ^ Local Government Act 1991, s. 26: Amendment of Local Government (Reorganisation) Act 1985 (No. 11 of 1991, s. 26). Enacted on 18 May 1991. Act of the Oireachtas. Retrieved from Irish Statute Book on 9 December 2021.
- ^ Local Government (Dublin) Act 1993, s. 12: Membership and cathaoirleach of county councils (No. 31 of 1993, s. 12). Enacted on 21 December 1993. Act of the Oireachtas. Retrieved from Irish Statute Book on 13 December 2021.
External links
- Official website[permanent dead link]
- irishelectionliterature


