2001 Northumberland County Council election
2001 UK local government election
 | |||||||||||||||||||||||||||||||||||||||||||||||||||||
All 67 seats to Northumberland County Council 34 seats needed for a majority | |||||||||||||||||||||||||||||||||||||||||||||||||||||
|---|---|---|---|---|---|---|---|---|---|---|---|---|---|---|---|---|---|---|---|---|---|---|---|---|---|---|---|---|---|---|---|---|---|---|---|---|---|---|---|---|---|---|---|---|---|---|---|---|---|---|---|---|---|
| Turnout | 61.6% | ||||||||||||||||||||||||||||||||||||||||||||||||||||
| |||||||||||||||||||||||||||||||||||||||||||||||||||||
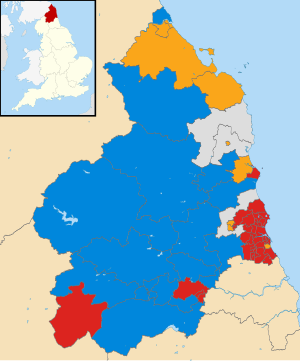 Map of the results of the 2001 local election. | |||||||||||||||||||||||||||||||||||||||||||||||||||||
| |||||||||||||||||||||||||||||||||||||||||||||||||||||
Local elections to Northumberland County Council, a county council in the north east of England, were held on 7 June 2001. It was the first election to be held under new ward boundaries that increased the number of seats from 66 to 67.[2] The Labour Party retained overall control of the council.
Results
| Party | Seats | Gains | Losses | Net gain/loss | Seats % | Votes % | Votes | +/− | |
|---|---|---|---|---|---|---|---|---|---|
| Labour | 38 | 40.7 |  4.1 4.1 | ||||||
| Conservative | 17 | 24.5 |  0.2 0.2 | ||||||
| Liberal Democrats | 9 | 29.7 | 3.7 | ||||||
| Independent | 3 | 4.6 | 0.9 | ||||||
| Green | 0 | 0.0 | 0.5 | 0.2 | |||||
References
External links
- Northumberland County Council
- v
- t
- e
 Council elections in Northumberland
- 1973
- 1976
- 1979
- 1983
- 1987
- 1991
- 1995
- 1999
- 2003
- 2007
- Abolished
- 1973
- 1976
- 1979
- 1983
- 1987
- 1991
- 1995
- 1999
- 2003
- 2007
- Abolished
- 1973
- 1976
- 1979
- 1983
- 1987
- 1991
- 1995
- 1999
- 2003
- 2007
- Abolished
- 1973
- 1976
- 1979
- 1983
- 1987
- 1991
- 1995
- 1999
- 2003
- 2007
- Abolished
- See also: Wards
- Boundary changes
| |
|---|---|
| County councils |
|
| Unitary authorities |
|
| District councils (Northern Ireland) | |
| Sui generis |
|
| |


