2008 UK local government election
2008 Stevenage Borough Council election First party Second party Party Labour Conservative Last election 32 3 Seats before 32 2 † Seats won 8 4 Seats after 30 5 Seat change Popular vote 8,361 7,382 Percentage 40.1% 35.4% Third party Fourth party Party Liberal Democrats UKIP Last election 4 0 Seats before 4 1 † Seats won 1 0 Seats after 3 1 Seat change Popular vote 3,489 853 Percentage 16.8% 4.1%
Map showing the results of contested wards in the 2007 Stevenage Borough Council elections.
† Councilor Marion Mason defected from Conservatives to UKIP in January 2008.
[1] Council control before election Labour
Council control after election Labour
Elections to Stevenage Council were held on 1 May 2008. One third of the council was up for election; the seats which were last contested in 2004 . The Labour Party stayed in overall control of the council.
The election saw the Conservative party gain 3 seats but the Labour party remained firmly in control of the council.
After the election, the composition of the council was:[2]
Election result Stevenage Local Election Result 2008 Party Seats Gains Losses Net gain/loss Seats % Votes % Votes +/− Labour 8 1 3 -2 61.5 40.1 8,361 -6.7% Conservative 4 3 0 +3 30.8 35.4 7,382 +5.2% Liberal Democrats 1 0 1 -1 7.7 16.8 3,489 -4.5% UKIP 0 0 0 0 0 4.1 853 +4.1% English Democrat 0 0 0 0 0 2.5 517 +2.5% Free England Party 0 0 0 0 0 0.8 158 +0.8% Green 0 0 0 0 0 0.3 67 -0.5%
Ward results
Bandley Hill Location of Bandley Hill ward Bandley Hill Party Candidate Votes % ±% Labour Lilian Strange 671 41.7 −10.1 Conservative Anita Speight 486 30.2 −0.3 English Democrat Carl Cooper 301 18.7 +18.7 Liberal Democrats Gordon Knight 153 9.5 −8.2 Majority 185 11.5 −9.8 Turnout 1,611 33.9 +1.5 Labour hold Swing
Bedwell Location of Bedwell ward Bedwell Party Candidate Votes % ±% Labour David Cullen 788 52.6 −8.1 Conservative Christine Saint-Leitner 467 31.2 +6.0 Liberal Democrats Leonard Lambert 243 16.2 +2.1 Majority 321 21.4 −14.1 Turnout 1,498 32.0 −4.3 Labour hold Swing
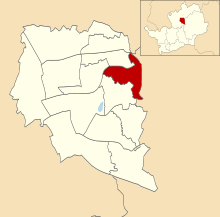
Chells Location of Chells ward Chells Party Candidate Votes % ±% Labour Vickie Warwick 792 43.8 +1.9 Liberal Democrats Gareth Steiner 540 29.8 −11.0 Conservative Matthew Wyatt 478 26.4 +9.1 Majority 252 14.0 +12.9 Turnout 1,810 38.0 −1.6 Labour gain from Liberal Democrats Swing
Longmeadow Location of Longmeadow ward Longmeadow Party Candidate Votes % ±% Conservative Matthew Hurst 688 40.4 +1.2 Labour Bruce Jackson 640 37.6 −4.2 Liberal Democrats Ralph Baskerville 199 11.7 −7.3 UKIP Julie Seddon 177 10.4 +10.4 Majority 48 2.8 Turnout 1,704 39.5 +1.6 Conservative gain from Labour Swing
Manor Location of Manor ward Manor Party Candidate Votes % ±% Liberal Democrats Graham Snell 805 40.8 −13.6 Conservative Susan Smith 609 30.9 +7.7 Labour Joseph Sherry 458 23.2 +0.8 UKIP Carol Knowles 101 5.1 +5.1 Majority 196 9.9 −21.3 Turnout 1,973 41.3 +0.0 Liberal Democrats hold Swing
Martins Wood Location of Martins Wood ward Martins Wood Party Candidate Votes % ±% Conservative Dilys Clark 611 37.6 −1.4 Labour Janet Raynor 574 35.3 −8.3 English Democrat John Cooper 216 13.3 +13.3 Liberal Democrats Barbara Segadelli 116 7.1 −10.3 Green Tom Moore 67 4.1 +4.1 UKIP Andrew Elwell 40 2.5 +2.5 Majority 37 2.3 Turnout 1,624 35.9 +1.6 Conservative gain from Labour Swing
Old Town Location of Old Town ward Old Town Party Candidate Votes % ±% Conservative James Fraser 886 42.1 +8.4 Labour Hugh Tessier 860 40.9 −8.1 Liberal Democrats Tennille Steiner 193 9.2 +0.1 UKIP Rick Seddon 165 7.8 +7.8 Majority 26 1.2 Turnout 2,104 41.2 −1.9 Conservative gain from Labour Swing
Pin Green Location of Pin Green ward Pin Green Party Candidate Votes % ±% Labour Simon Speller 649 47.6 −4.0 Conservative Leslie Clark 402 29.5 +6.5 Free England Party Richard Aitkins 158 11.6 +11.6 Liberal Democrats Mary Griffith 155 11.4 −1.1 Majority 247 18.1 −10.5 Turnout 1,364 32.0 −5.3 Labour hold Swing
Roebuck Location of Roebuck ward Roebuck Party Candidate Votes % ±% Labour John Lloyd 578 39.7 −12.5 Conservative Roger Gill 482 33.1 +2.4 UKIP Vicky Peebles 229 15.7 +15.7 Liberal Democrats Denise Baskerville 168 11.5 −5.5 Majority 96 6.6 −14.9 Turnout 1,457 32.9 −1.8 Labour hold Swing
St Nicholas Location of St Nicholas ward St Nicholas Party Candidate Votes % ±% Labour Richard Henry 605 44.5 −6.3 Conservative Gillian Mould 460 33.8 +6.5 Liberal Democrats Heather Snell 295 21.7 −0.2 Majority 145 10.7 −12.8 Turnout 1,360 31.6 −2.2 Labour hold Swing
Shephall Location of Shephall ward Shephall Party Candidate Votes % ±% Labour Jack Pickersgill 646 47.4 −8.9 Conservative Ralph Dimelow 355 26.0 +1.7 Liberal Democrats Nicholas Baskerville 221 16.2 −3.2 UKIP Bob Layson 141 10.3 +10.3 Majority 291 21.4 −10.6 Turnout 1,363 31.3 −1.3 Labour hold Swing
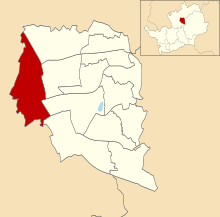
Symonds Green Location of Symonds Green ward Symonds Green Party Candidate Votes % ±% Labour Laurie Chester 733 47.6 −14.0 Conservative Paul Mould 599 38.9 +11.1 Liberal Democrats Clive Hearmon 209 13.6 +3.0 Majority 134 8.7 −25.1 Turnout 1,541 35.8 −3.0 Labour hold Swing
Woodfield Location of Woodfield ward Woodfield Party Candidate Votes % ±% Conservative Margaret Notley 859 60.6 +5.3 Labour Richard Rawlings 367 25.9 −3.1 Liberal Democrats Katherine Lloyd 192 13.5 −2.2 Majority 492 34.7 +8.4 Turnout 1,418 36.3 −0.8 Conservative hold Swing
References ^ "Stevenage Conservative councillor defects to UKIP". The Comet. 29 July 2013. ^ "Elections 2008". BBC News . 2008 Stevenage election result Ward results Tories gain seats in Stevenage Video: Stevenage election results


 Council elections in Hertfordshire


