Part of the 2009 Irish local elections
2009 South Dublin County Council election
|
|
All 26 seats on South Dublin County Council |
|---|
| | First party | Second party | Third party | | | | | | | Party | Labour | Fine Gael | Fianna Fáil | | Seats won | 9 | 8 | 4 | | Seat change | +2 | +5 | -2 |
| | | Fourth party | Fifth party | Sixth party | | | | | | | Party | Sinn Féin | People Before Profit | Independent | | Seats won | 3 | 1 | 1 | | Seat change | 0 | +1 | -1 |
| | | Seventh party | Eighth party | Ninth party | | | | | | | Party | Green | Socialist Party | Progressive Democrats | | Seats won | 0 | 0 | 0 | | Seat change | -2 | -1 | -2 | |
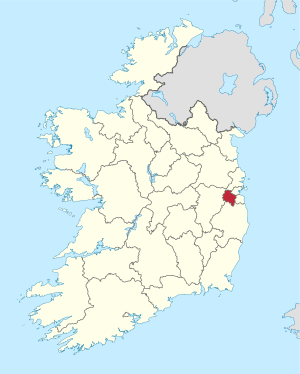 Map showing the area of South Dublin County Council |
| | Council control after election
TBD
| |
An election to South Dublin County Council took place on 5 June 2009 as part of that year's Irish local elections. 26 councillors were elected from five electoral divisions using the Single transferable vote system for a five-year term of office.
Results by party
| Party | Seats | ± | First Pref. votes | FPv% | ±% |
| | Labour | 9 | +2 | 21,813 | 24.13 | |
| | Fine Gael | 8 | +5 | 23,698 | 26.22 | |
| | Fianna Fáil | 4 | -2 | 15,290 | 16.92 | |
| | Sinn Féin | 3 | 0 | 9,661 | 10.69 | |
| | People Before Profit | 1 | +1 | 5,721 | 6.33 | |
| | Independent | 1 | -1 | 7,997 | 8.85 | |
| | Green | 0 | -2 | 3,345 | 3.70 | |
| | Socialist Party | 0 | -1 | 2,159 | 2.39 | |
| | Progressive Democrats | 0 | -2 | N/A | N/A | |
| Totals | 26 | 0 | 90,389 | 100.00 | — |
Results by local electoral area
Clondalkin
Clondalkin - 6 seats | Party | Candidate | FPv% | Count |
| 1 | 2 | 3 | 4 | 5 | 6 | 7 | 8 | 9 | 10 |
| | Labour | Robert Dowds* | 15.66 | 2,449 | | | | | | | | | |
| | Fine Gael | Tony Delaney* | 11.03 | 1,725 | 1,754 | 1,780 | 1,792 | 1,916 | 2,018 | 2,057 | 2,258 | | |
| | Fine Gael | Therese Ridge* | 10.07 | 1,575 | 1,600 | 1,623 | 1,657 | 1,742 | 1,813 | 1,857 | 2,092 | 2,188 | 2,294 |
| | Sinn Féin | Matthew McDonagh | 9.61 | 1,502 | 1,507 | 1,511 | 1,546 | 1,564 | 1,574 | 1,767 | 1,936 | 2,896 | |
| | Fianna Fáil | Jim Daly* | 8.02 | 1,254 | 1,256 | 1,267 | 1,268 | 1,372 | 1,531 | 1,541 | 1,568 | 1,595 | 1,617 |
| | Sinn Féin | Shane O'Connor* | 7.81 | 1,221 | 1,227 | 1,250 | 1,278 | 1,311 | 1,324 | 1,402 | 1,489 | | |
| | People Before Profit | Gino Kenny | 7.27 | 1,137 | 1,151 | 1,179 | 1,218 | 1,270 | 1,292 | 1,471 | 1,703 | 1,838 | 2,203 |
| | Fianna Fáil | Trevor Gilligan* | 6.61 | 1,034 | 1,046 | 1,079 | 1,104 | 1,174 | 1,476 | 1,513 | 1,587 | 1,652 | 1,713 |
| | Labour | Margaret McCarthy | 5.90 | 922 | 1,019 | 1,055 | 1,088 | 1,200 | 1,224 | 1,324 | | | |
| | Fianna Fáil | Thyes Kavanagh | 4.69 | 734 | 740 | 762 | 769 | 792 | | | | | |
| | Green | Dorothy Corrigan* | 4.37 | 683 | 690 | 718 | 725 | | | | | | |
| | Independent | John McCann | 4.21 | 658 | 663 | 692 | 897 | 917 | 932 | | | | |
| | Independent | Mark Ward | 2.62 | 410 | 413 | 453 | | | | | | | |
| | Independent | Jim McHale | 1.14 | 179 | 182 | | | | | | | | |
| | Independent | Gbemi Shogunle | 0.97 | 151 | 152 | | | | | | | | |
| Electorate: 36,859 Valid: 15,634 (42.42%) Spoilt: 295 Quota: 2,234 Turnout: 15,929 (43.22%) |
Lucan
Lucan - 5 seats | Party | Candidate | FPv% | Count |
| 1 | 2 | 3 | 4 | 5 | 6 | 7 | 8 | 9 | 10 | 11 |
| | Fine Gael | Derek Keating* | 26.88 | 4,146 | | | | | | | | | | |
| | Independent | Guss O'Connell* | 13.89 | 2,143 | 2,244 | 2,253 | 2,316 | 2,402 | 2,526 | 2,689 | | | | |
| | Labour | Eamon Tuffy* | 11.66 | 1,799 | 2,123 | 2,155 | 2,206 | 2,269 | 2,438 | 2,493 | 2,511 | 2,727 | | |
| | Fine Gael | William Lavelle | 8.47 | 1,307 | 1,939 | 1,957 | 2,022 | 2,057 | 2,122 | 2,191 | 2,207 | 2,340 | 2,608 | |
| | Fianna Fáil | Shane Moynihan | 5.63 | 868 | 939 | 994 | 1,013 | 1,029 | 1,062 | 1,495 | 1,537 | 1,625 | 1,810 | 1,834 |
| | Labour | Caitriona Jones* | 5.55 | 856 | 969 | 1,006 | 1,054 | 1,132 | 1,257 | 1,309 | 1,319 | 1,471 | 1,944 | 2,040 |
| | Fianna Fáil | Edno Cooney | 4.89 | 754 | 783 | 940 | 946 | 968 | 985 | | | | | |
| | Green | Kevin Farrell | 4.77 | 736 | 840 | 865 | 936 | 994 | 1,057 | 1,125 | 1,139 | 1,310 | | |
| | Workers' Party | Mick Finnegan | 4.57 | 705 | 745 | 752 | 774 | 871 | | | | | | |
| | Independent | Jim Doyle | 3.71 | 572 | 632 | 638 | 811 | 885 | 1,037 | 1,081 | 1,088 | | | |
| | Sinn Féin | Robert Ballesty | 3.68 | 568 | 588 | 597 | 610 | | | | | | | |
| | Independent | Tom Dowling | 3.39 | 523 | 587 | 594 | | | | | | | | |
| | Fianna Fáil | Shaleem Ahmed | 2.90 | 448 | 465 | | | | | | | | | |
| Electorate: 30,945 Valid: 15,425 (49.85%) Spoilt: 178 Quota: 2,571 Turnout: 15,603 (50.42%) |
Rathfarnam
Rathfarnam - 4 seats | Party | Candidate | FPv% | Count |
| 1 | 2 | 3 | 4 | 5 | 6 |
| | Fine Gael | Cáit Keane* | 21.01 | 3,639 | | | | | |
| | Fianna Fáil | John Lahart* | 20.81 | 3,605 | | | | | |
| | Labour | Paddy Cosgrave* | 19.80 | 3,431 | 3,460 | 3,482 | | | |
| | Fine Gael | Emma Coburn | 17.44 | 3,022 | 3,138 | 3,158 | 3,230 | 3,330 | 3,516 |
| | Independent | Vincent Kenny | 6.31 | 1,093 | 1,100 | 1,110 | 1,282 | 1,435 | 1,509 |
| | Green | Elizabeth Davidson | 5.66 | 981 | 992 | 1,006 | 1,056 | 1,172 | 1,348 |
| | Fianna Fáil | John Phelan | 3.45 | 597 | 603 | 670 | 687 | 720 | |
| | Sinn Féin | Sorcha Nic Cormaic | 3.18 | 551 | 553 | 556 | 586 | | |
| | Independent | Gerard Dolan | 1.32 | 228 | 229 | 231 | | | |
| | Independent | Frank O'Gorman | 1.02 | 177 | 179 | 181 | | | |
| Electorate: 32,136 Valid: 17,324 (53.91%) Spoilt: 190 Quota: 3,465 Turnout: 17,514 (54.50%) |
Tallaght Central
Tallaght Central - 6 seats | Party | Candidate | FPv% | Count |
| 1 | 2 | 3 | 4 | 5 | 6 | 7 | 8 | 9 |
| | Labour | Mick Duff | 13.15 | 3,125 | 3,151 | 3,206 | 3,287 | 3,373 | 3,460 | | | |
| | Fine Gael | Colm Brophy* | 12.98 | 3,085 | 3,094 | 3,170 | 3,211 | 3,307 | 3,369 | 3,378 | 4,270 | |
| | Sinn Féin | Seán Crowe* | 11.42 | 2,715 | 2,759 | 2,787 | 2,844 | 3,006 | 3,050 | 3,061 | 3,194 | 3,441 |
| | Labour | Pamela Kearns | 11.12 | 2,643 | 2,664 | 2,733 | 2,808 | 2,925 | 2,986 | 2,998 | 3,181 | 3,275 |
| | Labour | Dermot Looney | 9.80 | 2,329 | 2,346 | 2,382 | 2,418 | 2,849 | 2,894 | 2,902 | 3,105 | 3,318 |
| | Socialist Party | Mick Murphy* | 9.08 | 2,159 | 2,205 | 2,226 | 2,320 | 2,628 | 2,684 | 2,692 | 2,883 | 2,940 |
| | Fianna Fáil | Eamonn Walsh | 7.44 | 1,768 | 1,777 | 1,816 | 1,851 | 1,899 | 3,098 | 3,108 | 3,195 | 3,241 |
| | Fine Gael | Gay Kelly | 7.02 | 1,668 | 1,682 | 1,706 | 1,737 | 1,794 | 1,848 | 1,854 | | |
| | Fianna Fáil | Joe Neville* | 6.65 | 1,580 | 1,594 | 1,621 | 1,653 | 1,700 | | | | |
| | People Before Profit | Pat Dunne | 5.56 | 1,346 | 1,357 | 1,404 | 1,495 | | | | | |
| | Independent | David Hutchinson-Edgar | 2.36 | 562 | 630 | 655 | | | | | | |
| | Green | Arthur Doohan | 2.02 | 479 | 488 | | | | | | | |
| | Independent | Ray Kelly | 1.30 | 309 | | | | | | | | |
| Electorate: 44,783 Valid: 23,768 (53.07%) Spoilt: 295 Quota: 3,396 Turnout: 24,063 (53.73%) |
Tallaght South
Tallaght South - 5 seats | Party | Candidate | FPv% | Count |
| 1 | 2 | 3 | 4 | 5 | 6 | 7 | 8 |
| | Labour | Eamonn Maloney* | 15.40 | 2,344 | 2,377 | 2,445 | 2,499 | 2,540 | | | |
| | Sinn Féin | Cathal King* | 15.19 | 2,312 | 2,347 | 2,376 | 2,427 | 2,981 | | | |
| | Fine Gael | Brian Lawlor | 12.65 | 1,926 | 1,962 | 1,997 | 2,042 | 2,076 | 2,105 | 2,219 | 2,296 |
| | Labour | Marie Corr* | 12.58 | 1,915 | 2,000 | 2,148 | 2,193 | 2,318 | 2,452 | 2,799 | |
| | Fine Gael | Karen Warren* | 10.87 | 1,655 | 1,680 | 1,724 | 1,793 | 1,816 | 1,863 | 2,108 | 2,196 |
| | Fianna Fáil | John Hannon* | 10.13 | 1,542 | 1,616 | 1,647 | 2,038 | 2,060 | 2,087 | 2,167 | 2,211 |
| | Independent | Baby Perrepadan | 5.25 | 799 | 877 | 1,032 | 1,091 | 1,118 | 1,216 | | |
| | Sinn Féin | Sinead Cooke | 5.20 | 792 | 817 | 844 | 878 | | | | |
| | Fianna Fáil | Tara de Buitlear | 4.66 | 710 | 804 | 828 | | | | | |
| | Green | Tendai Madondo | 4.18 | 636 | 674 | | | | | | |
| | Fianna Fáil | Dermot Flanagan | 2.60 | 396 | | | | | | | |
| | Independent | Frank O'Gorman | 1.27 | 193 | | | | | | | |
| Electorate: 35,234 Valid: 15,220 (43.20%) Spoilt: 217 Quota: 2,537 Turnout: 15,437 (43.81%) |
External links
- Official website[permanent dead link]


