1987 UK local government election
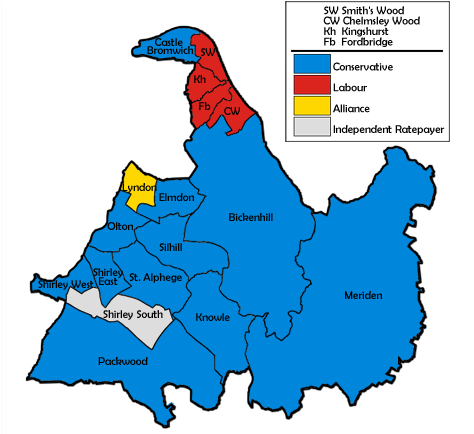
Map of the results for the 1987 Solihull council election. The 1987 Solihull Metropolitan Borough Council elections were held on Thursday, 7 May 1987, with one third of the council to be elected. The Conservatives retained control of the council. Voter turnout was 43.2%[ 1] [ 2]
Election result Solihull Local Election Result 1987 Party Seats Gains Losses Net gain/loss Seats % Votes % Votes +/− Conservative 11 1 1 0 64.7 51.0 34,504 +10.8 Labour 4 0 0 0 23.5 17.9 12,130 -10.1 Alliance 1 1 0 +1 5.9 22.8 15,412 -0.6 Independent Ratepayers & Residents 1 0 1 -1 5.9 8.1 5,499 -0.2 National Front 0 0 0 0 0.0 0.1 60 -0.0
This result had the following consequences for the total number of seats on the council after the elections:
Party Previous council New council Conservatives 29 29 Labour 14 14 Independent Ratepayers & Residents 6 5 Alliance 2 3 Total 51 51 Working majority 7 7
Ward results Bickenhill[ 1] Party Candidate Votes % ±% Conservative Mary Dingley 2,605 55.1 +10.7 Labour Peter McLoughlin 1,342 28.4 −9.3 Alliance (Liberal) David Moore 784 16.6 −1.4 Majority 1,263 26.7 +20.1 Turnout 4,731 47.1 +7.6 Conservative hold Swing +10.0
Castle Bromwich[ 1] Party Candidate Votes % ±% Conservative David Rees 2,886 64.5 +15.2 Alliance (SDP) John Walker 827 18.5 −4.3 Labour Robert Overton 763 17.0 −10.9 Majority 2,059 46.0 +24.7 Turnout 4,476 46.4 +7.0 Conservative hold Swing +9.8
Chelmsley Wood[ 1] Party Candidate Votes % ±% Labour Nicholas Stephens 1,461 51.5 −12.0 Conservative Robin Draycott 789 27.8 +8.7 Alliance (Liberal) Thomas Wrenn 529 18.6 +1.1 National Front Norman Tomkinson 60 2.1 +2.1 Majority 672 23.7 −20.7 Turnout 2,839 31.3 +5.7 Labour hold Swing -10.3
Elmdon[ 1] Party Candidate Votes % ±% Conservative Geoffrey Wood 2,107 48.8 +14.0 Labour Rona Miller 1,371 31.8 −11.7 Alliance (Liberal) Richard Blight 837 19.4 −2.3 Majority 736 17.1 +8.5 Turnout 4,315 48.4 +7.0 Conservative hold Swing +12.8
Fordbridge[ 1] Party Candidate Votes % ±% Labour Angela Reid 1,150 52.7 −28.8 Conservative Elizabeth Plaister 643 29.4 +10.9 Alliance (SDP) Bernadette Pruden 390 17.9 +17.9 Majority 507 23.3 −39.7 Turnout 2,183 28.9 +4.7 Labour hold Swing -19.9
Kingshurst[ 1] Party Candidate Votes % ±% Labour David Threlkeld 1,362 52.5 −17.6 Conservative Daphne Cleghorn 843 32.5 +2.7 Alliance (SDP) Mark Akhurst 387 14.9 +14.9 Majority 519 20.0 −20.3 Turnout 2,592 41.6 +6.3 Labour hold Swing -10.1
Knowle [ 1] Party Candidate Votes % ±% Conservative Thomas Morrison 2,726 66.6 +8.4 Alliance Jennifer Wright 1,182 28.9 −5.2 Labour Maurice Livingstone 183 4.5 −3.2 Majority 1,544 37.7 +13.6 Turnout 4,091 46.1 +9.5 Conservative hold Swing +6.8
Lyndon [ 1] Party Candidate Votes % ±% Alliance (Liberal) Ian Gillett 1,648 43.5 −2.6 Conservative David Wilkes 1,584 41.8 +12.0 Labour Walter Kinder 559 14.7 −9.3 Majority 64 1.7 −14.6 Turnout 3,791 44.6 +8.0 Alliance gain from Conservative Swing -7.3
Meriden [ 1] Party Candidate Votes % ±% Conservative Robert Meacham 2,411 56.8 +10.1 Alliance (SDP) John Johnson 1,655 39.0 −2.7 Labour Eveline Benton 176 4.1 −7.4 Majority 756 17.8 +12.7 Turnout 4,242 50.1 +8.4 Conservative hold Swing +6.4
Olton [ 1] Party Candidate Votes % ±% Conservative Stephen Eyre 2,614 54.3 +12.8 Alliance (Liberal) Timothy Farazmand 1,910 39.7 −7.0 Labour Sean McWhinne 291 6.0 −5.9 Majority 704 14.6 +9.4 Turnout 4,815 50.0 +13.8 Conservative hold Swing +9.9
Packwood[ 1] Party Candidate Votes % ±% Conservative Timothy Vernon 2,281 47.8 +4.3 Independent Residents David van Rest 2,270 47.6 −2.3 Labour Sheila Brookes 217 4.5 −2.0 Majority 11 0.2 −6.1 Turnout 4,768 50.9 +10.4 Conservative gain from Independent Residents Swing +3.3
Shirley East[ 1] Party Candidate Votes % ±% Conservative Reginald Davies 1,967 49.5 +10.1 Alliance (SDP) Ernest Garwood 854 21.5 −3.1 Independent Residents & Ratepayers Richard Jackson 810 20.4 −1.4 Labour Margaret Brittin 346 8.7 −5.5 Majority 1,113 28.0 +13.3 Turnout 3,977 40.1 +7.8 Conservative hold Swing +6.6
Shirley South[ 1] Party Candidate Votes % ±% Independent Ratepayers James Eames 2,419 47.9 −3.7 Conservative Peter Hogarth 2,223 44.0 +8.0 Labour Maurice Jones 408 8.1 −4.3 Majority 196 3.9 −11.7 Turnout 5,050 42.4 +9.3 Independent Ratepayers hold Swing -5.8
Shirley West[ 1] Party Candidate Votes % ±% Conservative Terence Powell 2,071 54.2 +15.3 Alliance (Liberal) John Reeve 1,303 34.1 −3.1 Labour Christine Horton 449 11.7 −10.3 Majority 768 20.1 +18.4 Turnout 3,823 39.1 +9.0 Conservative hold Swing +9.2
Silhill[ 1] Party Candidate Votes % ±% Conservative Geoffrey Gibbons 2,647 60.4 +12.0 Alliance (SDP) Peter Congdon 1,363 31.1 −6.0 Labour Colin Smith 372 8.5 −6.0 Majority 1,284 29.3 +18.0 Turnout 4,382 42.2 +9.7 Conservative hold Swing +9.0
Smith's Wood [ 1] Party Candidate Votes % ±% Labour Donald Cornock 1,529 51.5 −28.0 Conservative Mark Saunders 818 27.5 +7.0 Alliance (SDP) Ann Clements 623 21.0 +21.0 Majority 711 24.0 −35.0 Turnout 2,970 32.3 +4.2 Labour hold Swing -17.5
St. Alphege[ 1] Party Candidate Votes % ±% Conservative Ronald Herd 3,289 72.1 +12.9 Alliance (SDP) Gomer Thomas 1,120 24.6 −10.7 Labour Graham Craig 151 3.3 −2.3 Majority 2,169 47.6 +23.6 Turnout 4,560 47.6 +13.0 Conservative hold Swing +11.8
References ^ a b c d e f g h i j k l m n o p q r "Solihull M. B. C. Election Results Sheet, 7 May 1987", Solihull M.B.C.(1987). ^ "Vote 2012: Solihull". BBC News Online . Retrieved 26 January 2013 .
 Council elections in the West Midlands


