2022 welsh city and county of Swansea council election
2022 City and County of Swansea Council election |
All 75 seats in the City and County of Swansea Council
38 seats needed for a majority |
| Turnout | 36% |
|---|
| Party | % | Seats | +/– | | Labour | 55% | 45 | −3 | | Liberal Democrats | 14% | 11 | +4 | | Conservative | 12% | 7 | −1 | | Independents | 5% | 5 | +3 | | Uplands | 4% | 4 | +2 | | Independents@Swansea | 1% | 2 | −1 | | Greens | 3% | 1 | +1 | | Plaid Cymru | 4% | 0 | 0 | This lists parties that won seats. See the complete results below. 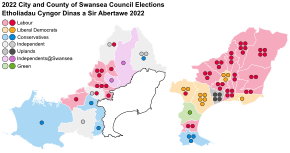 Map of the results of the 2022 City and County of Swansea Council election |
| Leader of the council before | Leader of the council after | Rob Stewart
Labour | Rob Stewart
Labour | |
The 2022 election to the City and County of Swansea Council took place on 5 May 2022 as part of the 2022 Welsh local elections. Seventy five seats were up for election across 32 wards. The previous full election took place in 2017.
Background
Ward changes
As the result of a ward boundary review, the number of wards were reduced from 36 to 32, but with the number of councillors increasing from 72 to 75, effective from the 2022 election. The changes were designed to make the ratio between councillors and voters more equal.[1][2]
Fifteen ward boundaries would be unaffected though a significant number of wards were merged or amended.[1] The Mawr ward ceased to exist, it's communities divied amongst neighbouring wards and a new ward of Pontlliw and Tircoed created. A Mumbles ward was created by merging the Newton and Oystermouth wards. A Llwchwr ward was created by merging Kingsbridge, Lower Loughor and Upper Loughor. A new Waterfront ward was created from parts of the Castle ward and St Thomas ward. A new Waunarlwydd ward was created from part of Cockett.[2] Dunvant, Killay North and Killay South were merged to create a Dunvant and Killay ward. The Gorseinon and Penyrheol wards were combined to become Gorseinon and Penyrheol.
Results
Seventy five seats were up for election and the Labour Party held onto power, despite losing three seats overall. The Labour council leader, Rob Stewart, partly blamed the recent ward boundary changes for their losses.[3] In the Clydach ward, the Conservatives won a seat by eight votes, after two recounts. The Liberal Democrats gained four seats overall, while the council also gained its first ever Green Party councillor, in Mayals.[3] The Uplands Party won an additional two seats off Labour in the Uplands ward, despite a candidate suffering a heart attack while out campaigning.[4]
Ward results
The following results were announced following the elections.[3][5]
Bishopston (one seat)
Bishopston 2022 | Party | Candidate | Votes | % | ±% |
| | Conservative | Lyndon Jones* | 903 | 62.1 | |
| | Labour | Clare-Anna Mitchell | 432 | 29.7 | |
| | Green | Karen Laurence | 63 | 4.3 | |
| | Liberal Democrats | Howard Evans | 56 | 3.9 | |
| Turnout | 1,454 | 52.6 | –4.2 |
| | Conservative hold | Swing | | |
Bon-y-maen (two seats)
Bon-y-maen 2022 | Party | Candidate | Votes | % | ±% |
| | Labour | Paul Lloyd* | 1,072 | 78.2 | |
| | Labour | Mandy Evans* | 1,056 | 77.0 | |
| | Independent | Richard Mylan | 193 | 14.1 | |
| | Conservative | Miles Thomas | 128 | 9.3 | |
| | Conservative | Jayne Isaac | 106 | 7.7 | |
| Turnout | 1,371 | 24.6 | –4.3 |
| | Labour hold | Swing | | |
| | Labour hold | Swing | | |
Castle (four seats)
Castle 2022 | Party | Candidate | Votes | % | ±% |
| | Labour | Fiona Gordon* | 1,613 | 68.0 | |
| | Labour | Hannah Lawson* | 1,564 | 65.9 | |
| | Labour | Patience Bentu | 1,533 | 64.6 | |
| | Labour | David Phillips* | 1,475 | 62.2 | |
| | Plaid Cymru | Patrick Powell | 452 | 19.0 | |
| | Green | John Pitans | 376 | 15.8 | |
| | Independent | Heather Burdett | 301 | 12.7 | |
| | Conservative | Elaine Hughes | 290 | 12.2 | |
| | Conservative | Sonya Morris | 267 | 11.3 | |
| | Liberal Democrats | Ben Williams | 246 | 10.4 | |
| | TUSC | Gareth Bromhall | 117 | 4.9 | |
| | Freedom Alliance | Katon Bouzalakos | 110 | 4.6 | |
| | TUSC | Owen Lees | 110 | 4.6 | |
| Turnout | 2,373 | 25.6 | –4.2 |
| | Labour hold | Swing | | |
| | Labour hold | Swing | | |
| | Labour hold | Swing | | |
| | Labour hold | Swing | | |
Hannah Lawson had been councillor for the ward, since replacing the late Sybil Crouch at a 2021 by-election.[6]
Clydach (three seats)
Clydach 2022 | Party | Candidate | Votes | % | ±% |
| | Independent | Gordon Walker* | 2,025 | 68.8 | |
| | Independent | Matthew Bailey | 1,844 | 62.6 | |
| | Conservative | Brigitte Rowlands** | 1,003 | 34.1 | |
| | Labour | Susan Powell | 995 | 33.8 | |
| | Labour | Wez Morgan | 951 | 32.3 | |
| | Labour | Dylan Williams | 823 | 28.0 | |
| Turnout | 2,944 | 43.4 | +15.0 |
| | Independent hold | Swing | | |
| | Independent gain from Labour | Swing | | |
| | Conservative win (new seat) |
Brigitte Rowlands was the councillor for the Mawr ward, which was partly incorporated into Clydach in 2022.
Cockett (three seats)
Cockett 2022 | Party | Candidate | Votes | % | ±% |
| | Labour | Mike Durke* | 1,414 | 63.7 | |
| | Labour | Oliver James* | 1,378 | 62.0 | |
| | Labour | Elliott King* | 1,310 | 59.0 | |
| | Green | Marie Greaves | 408 | 18.4 | |
| | Liberal Democrats | Vivienne Samuel | 395 | 17.8 | |
| | Conservative | Steve Norman | 394 | 17.7 | |
| | Liberal Democrats | Rhian Russell | 318 | 14.3 | |
| | Freedom Alliance | Kim Brooker | 167 | 7.5 | |
| Turnout | 2,221 | 27.7 | –5.0 |
| | Labour hold | Swing | | |
| | Labour hold | Swing | | |
| | Labour hold | Swing | | |
Cwmbwrla (three seats)
Cwmbwrla 2022 | Party | Candidate | Votes | % | ±% |
| | Liberal Democrats | Peter Black* | 1,455 | 74.6 | |
| | Liberal Democrats | Christopher Holley* | 1,160 | 59.5 | |
| | Liberal Democrats | Graham Thomas* | 1,136 | 58.2 | |
| | Labour | Margaret Greenaway | 537 | 27.5 | |
| | Labour | Malcom Harrington | 488 | 25.0 | |
| | Labour | Ian Isaac | 431 | 22.1 | |
| | Green | Rhiannon Wall | 106 | 5.4 | |
| | Conservative | Chris Griffiths | 82 | 4.2 | |
| | Freedom Alliance | Ilona Gofmaniene | 38 | 1.9 | |
| Turnout | 1,951 | 34.1 | –4.1 |
| | Liberal Democrats hold | Swing | | |
| | Liberal Democrats hold | Swing | | |
| | Liberal Democrats hold | Swing | | |
Dunvant and Killay (three seats)
Dunvant and Killay 2022 | Party | Candidate | Votes | % | ±% |
| | Liberal Democrats | Mary Jones** | 1,442 | 41.9 | |
| | Liberal Democrats | Jeff Jones** | 1,391 | 40.4 | |
| | Labour | Louise Gibbard** | 1,335 | 38.8 | |
| | Labour | Mark Davies | 1,319 | 38.3 | |
| | Labour | José Cifuentes | 1,288 | 37.4 | |
| | Liberal Democrats | Beth Rowe | 1,248 | 36.3 | |
| | Green | Jim Robinson | 361 | 10.5 | |
| | Conservative | David Jeffreys | 357 | 10.4 | |
| | Conservative | Jonathan Jones | 340 | 9.9 | |
| | Conservative | Ross Lock | 302 | 8.8 | |
| | Plaid Cymru | Rhiannon Barrar | 278 | 8.1 | |
| | Plaid Cymru | Margot Morgan | 177 | 5.1 | |
| | Plaid Cymru | Sharon-Rose Taylor | 151 | 4.4 | |
| Turnout | 3,440 | 46.1 | +4.1 |
| | Liberal Democrats win (new seat) |
| | Liberal Democrats win (new seat) |
| | Labour win (new seat) |
Ward formed by the merger of Dunvant, Killay North and Killay South wards. Gibbard was a sitting councillor for Dunvant, while Mary Jones and Jeff Jones were the sitting councillors in Killay North and Killay South respectively.
Fairwood (one seat)
Fairwood 2022 | Party | Candidate | Votes | % | ±% |
| | Conservative | Paxton Hood‐Williams* | 434 | 40.6 | |
| | Labour | Jane Harris | 341 | 31.9 | |
| | Green | Matthew Ward | 194 | 18.1 | |
| | Liberal Democrats | Philip Ebden | 101 | 9.4 | |
| Turnout | 1074 | 47.1 | –5.7 |
| | Conservative hold | Swing | | |
Gorseinon and Penyrheol (three seats)
Gorseinon and Penyrheol 2022 | Party | Candidate | Votes | % | ±% |
| | Labour | Andrew Stevens** | 2,073 | 74.6 | |
| | Labour | Jan Curtice** | 2,018 | 72.7 | |
| | Labour | Nicola Matthews | 1,800 | 64.8 | |
| | Conservative | Brett Roberts | 511 | 18.4 | |
| | Green | Anthony James | 453 | 16.3 | |
| | Liberal Democrats | Anthony Foligno | 317 | 11.4 | |
| Turnout | 2,777 | 35.1 | |
| | Labour win (new seat) |
| | Labour win (new seat) |
| | Labour win (new seat) |
Curtice and Stevens won the two seats in the Penyrheol ward at the previous 2017 election. Labour won the Gorseinon seat at the same election.
Gower (one seat)
Gower 2022 | Party | Candidate | Votes | % | ±% |
| | Conservative | Richard Lewis* | 719 | 56.2 | |
| | Labour | Cynthia Phillips | 334 | 26.1 | |
| | Green | Steven Davies | 123 | 9.6 | |
| | Liberal Democrats | Patrick Furlong | 103 | 8.1 | |
| Turnout | 1,289 | 50.0 | –1.9 |
| | Conservative gain from Independent | Swing | | |
Sitting member Richard Lewis had been elected as an Independent at the previous 2017 election.
Gowerton (two seats)
Gowerton 2022 | Party | Candidate | Votes | % | ±% |
| | Independent | Susan Jones* | 1,044 | 61.2 | |
| | Labour | Dai Jenkins | 624 | 36.6 | |
| | Labour | Wilf Smith | 407 | 23.8 | |
| | Liberal Democrats | Matthew Palmer | 391 | 22.9 | |
| | Conservative | Alex Williams | 380 | 22.3 | |
| | Plaid Cymru | Brian Edy | 244 | 14.3 | |
| Turnout | 1,707 | 42.6 | +13.8 |
| | Independent hold | Swing | | |
| | Labour win (new seat) |
Landore (two seats)
Landore 2022 | Party | Candidate | Votes | % | ±% |
| | Labour | Beverley Hopkins* | 1,044 | 79.1 | |
| | Labour | Mike White* | 1,026 | 77.7 | |
| | Liberal Democrats | Helen Thomas | 170 | 12.9 | |
| | Conservative | Owain Thomas | 146 | 11.1 | |
| Turnout | 1320 | 26.7 | –1.8 |
| | Labour hold | Swing | | |
| | Labour hold | Swing | | |
Llangyfelach (one seat)
Llangyfelach 2022 | Party | Candidate | Votes | % | ±% |
| | Independent | Mark Tribe | 750 | 65.9 | |
| | Labour | Robert Marshall | 259 | 22.8 | |
| | Conservative | Euan Renesto | 78 | 6.9 | |
| | Plaid Cymru | Adrian Roberts | 51 | 4.5 | |
| Turnout | 1,138 | 50.2 | +11.5 |
| | Independent hold | Swing | | |
Llansamlet (four seats)
Llansamlet 2022 | Party | Candidate | Votes | % | ±% |
| | Labour | Ryland Doyle* | 2,233 | 70.5 | |
| | Labour | Penny Matthews* | 2,110 | 66.6 | |
| | Labour | Matthew Jones | 1,924 | 60.8 | |
| | Labour | Alyson Pugh* | 1,862 | 58.8 | |
| | Plaid Cymru | Trystan Gjertson | 828 | 26.1 | |
| | Conservative | Jason Thomas | 541 | 17.1 | |
| | Liberal Democrats | Derek Russell | 436 | 13.8 | |
| Turnout | 3,167 | 27.8 | –3.2 |
| | Labour hold | Swing | | |
| | Labour hold | Swing | | |
| | Labour hold | Swing | | |
| | Labour hold | Swing | | |
Llwchwr (three seats)
Llwchwr 2022 | Party | Candidate | Votes | % | ±% |
| | Labour | Kelly Roberts | 1,884 | 61.3 | |
| | Labour | Robert Smith** | 1,790 | 58.2 | |
| | Labour | Adam Davis | 1,741 | 56.6 | |
| | Plaid Cymru | Jason Lovell | 597 | 19.4 | |
| | Plaid Cymru | Kieran Pritchard | 505 | 16.4 | |
| | Conservative | Raymond Hinds | 503 | 16.4 | |
| | Conservative | Barbara Jones | 503 | 16.4 | |
| | Plaid Cymru | James Edy | 393 | 12.8 | |
| | Gwlad | Wayne Erasmus | 121 | 3.9 | |
| | TUSC | John Evans | 78 | 2.5 | |
| Turnout | 3075 | 40.0 | N/A |
| | Labour win (new seat) |
| | Labour win (new seat) |
| | Labour win (new seat) |
Robert Smith was the councillor for the former ward of Upper Loughor.
Mayals (one seat)
Mayals 2022 | Party | Candidate | Votes | % | ±% |
| | Green | Chris Evans | 457 | 40.4 | |
| | Conservative | Louise Thomas | 332 | 29.4 | |
| | Labour | Pam Erasmus | 280 | 24.8 | |
| | Liberal Democrats | Daniel Guttery | 62 | 5.5 | |
| Turnout | 1,138 | 51.4 | –0.9 |
| | Green gain from Conservative | Swing | | |
Morriston (five seats)
Morriston 2022 | Party | Candidate | Votes | % | ±% |
| | Labour | Ceri Evans* | 2,741 | 74.6 | |
| | Labour | Rob Stewart* | 2,665 | 72.6 | |
| | Labour | Robert Francis-Davies* | 2,487 | 67.7 | |
| | Labour | Andrea Lewis* | 2,471 | 67.2 | |
| | Labour | Yvonne Jardine* | 2,366 | 64.3 | |
| | Conservative | Jake Harry | 670 | 18.2 | |
| | Conservative | Ian Scott | 668 | 18.2 | |
| | Independent | Gail John | 546 | 14.9 | |
| | Liberal Democrats | Gareth Healey | 538 | 14.6 | |
| Turnout | 3,676 | 29.6 | –4.8 |
| | Labour hold | Swing | | |
| | Labour hold | Swing | | |
| | Labour hold | Swing | | |
| | Labour hold | Swing | | |
| | Labour hold | Swing | | |
Mumbles (three seats)
Mumbles 2022 | Party | Candidate | Votes | % | ±% |
| | Conservative | Will Thomas** | 1,760 | 51.9 | |
| | Conservative | Francesca O'Brien | 1,510 | 44.5 | |
| | Conservative | Angela O'Connor | 1,478 | 43.6 | |
| | Labour | Carrie Townsend Jones | 1,234 | 36.4 | |
| | Labour | Martin O'Neill | 1,156 | 34.1 | |
| | Labour | Richard Jarvis | 1,155 | 34.0 | |
| | Green | Will Beasley | 563 | 16.6 | |
| | Plaid Cymru | Patricia Sanderson | 366 | 10.8 | |
| | Liberal Democrats | Allan Williams | 273 | 8.0 | |
| Turnout | 3,393 | 50.4 | N/A |
| | Conservative win (new seat) |
| | Conservative win (new seat) |
| | Conservative win (new seat) |
Will Thomas was councillor for the former Newton ward prior to the election.
Mynydd-bach (three seats)
Mynydd-bach 2022 | Party | Candidate | Votes | % | ±% |
| | Labour | Mike Lewis* | 1,485 | 72.0 | |
| | Labour | Jess Pritchard | 1,389 | 67.3 | |
| | Labour | Sam Pritchard* | 1,313 | 63.6 | |
| | Conservative | Paul Morris | 457 | 22.2 | |
| | Liberal Democrats | Ann Jamaluddin | 352 | 17.1 | |
| Turnout | 2,063 | 31.0 | –2.5 |
| | Labour hold | Swing | | |
| | Labour hold | Swing | | |
| | Labour hold | Swing | | |
Pen-clawdd (one seat)
Pen-clawdd 2022 | Party | Candidate | Votes | % | ±% |
| | Labour | Andrew Williams | 903 | 60.8 | |
| | Plaid Cymru | John Davies | 337 | 22.7 | |
| | Conservative | Alex Lewis | 152 | 10.2 | |
| | Liberal Democrats | Mike Sheehan | 92 | 6.2 | |
| Turnout | 1,488 | 50.1 | +6.0 |
| | Labour hold | Swing | | |
Penderry (three seats)
Penderry 2022 | Party | Candidate | Votes | % | ±% |
| | Labour | Hazel Morris* | 1,022 | 74.1 | |
| | Labour | Terry Hennegan* | 1,019 | 73.9 | |
| | Labour | Erika Kirchner | 967 | 70.1 | |
| | Conservative | Jasmine Rowlands-Lean | 269 | 19.5 | |
| Turnout | 1,379 | 17.8 | –3.9 |
| | Labour hold | Swing | | |
| | Labour hold | Swing | | |
| | Labour hold | Swing | | |
Penllergaer (one seat)
Penllergaer 2022 | Party | Candidate | Votes | % | ±% |
| | Independent | Wendy Fitzgerald* | 971 | 87.8 | |
| | Labour | Anthony Phillips | 135 | 12.2 | |
| Turnout | 1,110 | 41.3 | –6.4 |
| | Independent hold | Swing | | |
Pennard (one seat)
Pennard 2022 | Party | Candidate | Votes | % | ±% |
| | Independent | Lynda James* | 647 | 50.2 | |
| | Conservative | Ben Walker | 334 | 25.9 | |
| | Labour | Cari Jones | 309 | 24.0 | |
| Turnout | 1,293 | 47.6 | –11.4 |
| | Independent hold | Swing | | |
Pontarddulais (two seats)
Pontarddulais 2022 | Party | Candidate | Votes | % | ±% |
| | Independent | Kevin Griffiths* | 1,217 | 56.4 | |
| | Labour | Philip Downing* | 886 | 41.1 | |
| | Labour | Catherine Evans | 808 | 37.5 | |
| | Independent | Roddy John | 749 | 34.7 | |
| | Plaid Cymru | Jamie Johnstone | 409 | 19.0 | |
| Turnout | 2,156 | 40.7 | +15.1 |
| | Independent hold | Swing | | |
| | Labour hold | Swing | | |
Pontlliw and Tircoed (one seat)
Pontlliw and Tircoed 2022 | Party | Candidate | Votes | % | ±% |
| | Labour | Victoria Holland | 450 | 51.5 | |
| | Independent | Byron Lewis | 424 | 48.5 | |
| Turnout | 880 | 41.6 | N/A |
| | Labour win (new seat) |
St Thomas (two seats)
St Thomas 2022 | Party | Candidate | Votes | % | ±% |
| | Labour | Hayley Gwilliam | 1,043 | 79.3 | |
| | Labour | Joe Hale* | 1,013 | 77.0 | |
| | Conservative | Elizabeth Grace Thomas | 253 | 19.2 | |
| | Liberal Democrats | Robert Hall | 172 | 13.1 | |
| | Conservative | Jack Dean | 158 | 12.0 | |
| | Freedom Alliance | Getrude Papaleni Shilongo | 58 | 4.4 | |
| Turnout | 1,316 | 26.8 | –3.5 |
| | Labour hold | Swing | | |
| | Labour hold | Swing | | |
Sketty (five seats)
Sketty 2022 | Party | Candidate | Votes | % | ±% |
| | Liberal Democrats | Michael Day* | 2,509 | 48.2 | |
| | Liberal Democrats | Cheryl Philpott* | 2,358 | 45.3 | |
| | Liberal Democrats | Nicola Furlong | 2,102 | 40.4 | |
| | Liberal Democrats | Michael Locke | 2,028 | 38.9 | |
| | Liberal Democrats | James McGettrick | 2,009 | 38.6 | |
| | Labour | Mahaboob Basha | 1,987 | 38.2 | |
| | Labour | Sam Dredge | 1,684 | 32.3 | |
| | Labour | Greg James | 1,657 | 31.8 | |
| | Labour | Natalie Hussey | 1,649 | 31.7 | |
| | Labour | Philip Thompson | 1,433 | 27.5 | |
| | Conservative | Stephen Gallagher* | 765 | 14.7 | |
| | Conservative | David Helliwell* | 740 | 14.2 | |
| | Green | Nigel Bartolotti Hill | 724 | 13.9 | |
| | Conservative | Stacey Norman | 666 | 12.8 | |
| | Conservative | Jacob Derluk | 647 | 12.4 | |
| | Conservative | Rebecca Singh | 595 | 11.4 | |
| | Plaid Cymru | Dave Lewis | 523 | 10.0 | |
| | Plaid Cymru | Sian Thomas | 498 | 9.6 | |
| | Freedom Alliance | Simon Stern | 76 | 1.5 | |
| Turnout | 5,208 | 46.6 | +2.0 |
| | Liberal Democrats hold | Swing | | |
| | Liberal Democrats hold | Swing | | |
| | Liberal Democrats gain from Labour | Swing | | |
| | Liberal Democrats gain from Conservative | Swing | | |
| | Liberal Democrats gain from Conservative | Swing | | |
Townhill (three seats)
Townhill 2022 | Party | Candidate | Votes | % | ±% |
| | Labour | Cyril Anderson* | 955 | 76.0 | |
| | Labour | Lesley Walton* | 903 | 71.8 | |
| | Labour | David Hopkins* | 900 | 71.6 | |
| | Green | Steven Clegg | 171 | 13.6 | |
| | Liberal Democrats | Cameron Shippam | 139 | 11.1 | |
| | Conservative | Rob Thomas | 118 | 9.4 | |
| | Freedom Alliance | Jacquelyn Haley | 103 | 8.2 | |
| | Independent | Marguerite Tcheko | 81 | 6.4 | |
| Turnout | 1,257 | 21.2 | –4.2 |
| | Labour hold | Swing | | |
| | Labour hold | Swing | | |
| | Labour hold | Swing | | |
Uplands (four seats)
Uplands 2022 | Party | Candidate | Votes | % | ±% |
| | Uplands | Peter May* | 1,978 | 60.1 | |
| | Uplands | Sandra Joy | 1,787 | 54.3 | |
| | Uplands | Stuart Rice | 1,663 | 50.5 | |
| | Uplands | Allan Jeffery | 1,641 | 49.8 | |
| | Labour | Rebecca Francis-Davies | 1,279 | 38.8 | |
| | Labour | Libby Nolan | 1,112 | 33.8 | |
| | Labour | Robyn Parker | 1,038 | 31.5 | |
| | Labour | Ceri Powe | 1,004 | 30.5 | |
| | Plaid Cymru | Adonis El-Salloukh | 331 | 10.1 | |
| | Liberal Democrats | Chloe Hutchinson | 178 | 5.4 | |
| | Liberal Democrats | Michael O'Carroll | 153 | 4.6 | |
| | Liberal Democrats | Trudi Hancock | 140 | 4.3 | |
| | Liberal Democrats | Benjamin Falkner | 130 | 3.9 | |
| | Freedom Alliance | Michelle Valerio | 95 | 2.9 | |
| | TUSC | Evan Vaughan | 70 | 2.1 | |
| | TUSC | Oisin Mulhulland | 69 | 2.1 | |
| | TUSC | Charlie Wells | 61 | 1.9 | |
| Turnout | 3,293 | 31.8 | –6.0 |
| | Uplands hold | Swing | | |
| | Uplands hold | Swing | | |
| | Uplands gain from Labour | Swing | | |
| | Uplands gain from Labour | Swing | | |
Waterfront (one seat)
Waterfront 2022 | Party | Candidate | Votes | % | ±% |
| | Liberal Democrats | Sam Bennett | 590 | 60.5 | |
| | Labour | Adam Gilbert | 309 | 31.7 | |
| | Conservative | Austin Elias | 77 | 7.9 | |
| Turnout | 981 | 36.8 | N/A |
| | Liberal Democrats win (new seat) |
Waunarlwydd (one seat)
Waunarlwydd 2022 | Party | Candidate | Votes | % | ±% |
| | Labour | Wendy Lewis** | 694 | 68.2 | |
| | Green | Stan Gurung | 221 | 21.7 | |
| | Conservative | Matthew Gates | 77 | 7.6 | |
| | Liberal Democrats | Edmund Sides | 25 | 2.5 | |
| Turnout | 1,019 | 38.9 | N/A |
| | Labour win (new seat) |
Wendy Lewis was formerly a councillor for the Cockett ward, which until this election included Waunarlwydd.
West Cross (two seats)
West Cross 2022 | Party | Candidate | Votes | % | ±% |
| | Labour | Rebecca Fogarty | 1,241 | 57.0 | |
| | Labour | Sara Keeton | 1,152 | 52.9 | |
| | Conservative | Emilie Cox | 719 | 33.0 | |
| | Conservative | Thomas Beynon | 692 | 31.8 | |
| | Green | Anna Pigott | 258 | 11.8 | |
| Turnout | 2,178 | 46.5 | +13.9 |
| | Labour hold | Swing | | |
| | Labour hold | Swing | | |
*' = sitting councillor in same ward prior to election
**' = sitting councillor in a related former ward prior to election
References
- ^ a b Richard Youle (30 June 2021). "Swansea is to have three more councillors next year as some boundaries change". Wales Online. Retrieved 24 May 2022.
- ^ a b "More councillors but fewer wards after council boundary changes in Swansea". Swansea Bay News. 30 June 2021. Retrieved 24 May 2022.
- ^ a b c Ruth Mosalski; Will Hayward; Richard Youle (6 May 2022). "Swansea local election result 2022: Labour holds onto power". Wales Online. Retrieved 2022-05-19.
- ^ Richard Youle. "A man who had a cardiac arrest while campaigning and needed eight injections to save his life has been elected". Wales Online. Retrieved 2022-05-19.
- ^ "Election results by wards - Local Government Elections - Thursday, 5 May 2022". Swansea Council. Retrieved 2022-05-28.
- ^ "Castle Ward - Swansea". Local Elections Archive Project. Retrieved 2022-05-28.

 3
3  4
4  Council elections in the preserved county of West Glamorgan


